Generic selectors
Exact matches only
Search in title
Search in content
Post Type Selectors

Popular stocks

Crypto

CFD

Currencies

Support

Gold

EUR/USD – Technical Analysis – 4h

December 15, 2025 08:02

Quick Summary

The EUR/USD chart exhibits a bullish trend, supported by significant candlestick patterns. The recent price action indicates potential for further upward movement, yet caution is warranted due to signs of consolidation.

The asset shows increased buy interest around key levels.

Candlestick Analysis

There is a prominent bullish candlestick pattern leading up to the recent high, indicative of strong buying pressure.

A potential Doji is forming, suggesting indecision in the market which may precede a reversal or continuation.

The recent high around 1.17500 could act as a breakout zone. A pullback to 1.17000 could test support.

MACD Analysis

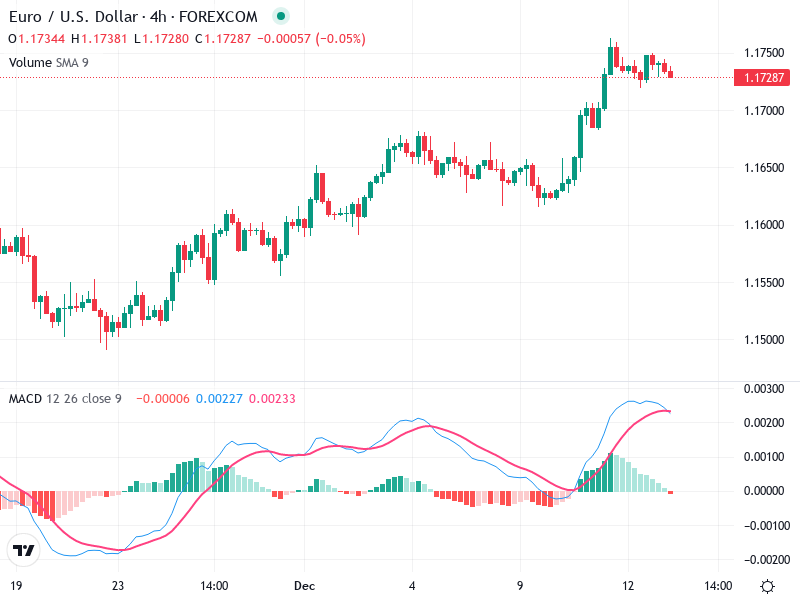
A recent bullish crossover is noticeable, with the MACD line crossing above the Signal line about a week ago, maintaining bullish momentum.

The histogram shows positive momentum but is starting to decline, indicating the current upward momentum may be weakening.

No significant divergence between MACD and price action is observed for now, as both follow the upward trend.

Volume Analysis

Volume increased significantly in conjunction with the bullish move, supporting the price increase.

Recent volumes have diminished slightly, which is typical as prices stabilize or correct.

Unusual volume spikes around the breakout could indicate institutional buying during the initial bullish move.

Support & Resistance

The 1.17000 level acts as immediate support given recent price action.

The recent high near 1.17500 is key resistance, as a breakout above this level could indicate further bullish movement.

These levels are crucial for assessing potential entry and exit points.

Actionable Insights

Consider entering on pullbacks towards the support level of 1.17000, looking for bullish confirmation signals.

If prices fail to break the 1.17500 level with strong momentum and candlestick confirmation, consider shorting with a tight stop above the resistance.

If currently in a position, watch for confirmation of either continuation above 1.17500 or a retracement below 1.17000 for decision-making.

The AI Technical Analysis Center is an informational tool only and does not constitute investment or trading advice.
This site is registered on wpml.org as a development site. Switch to a production site key to remove this banner.