Generic selectors
Exact matches only
Search in title
Search in content
Post Type Selectors

Popular stocks

Crypto

CFD

Currencies

Support

Gold

NSDQ – Technical Analysis – 4h

December 16, 2025 08:01

Quick Summary

The chart of is showing crucial levels that could dictate future price movements. Currently, the market sentiment appears largely bearish, but key support levels might offer a reversal opportunity. Close attention should be paid to volume trends to gauge the market strength.

Candlestick Analysis

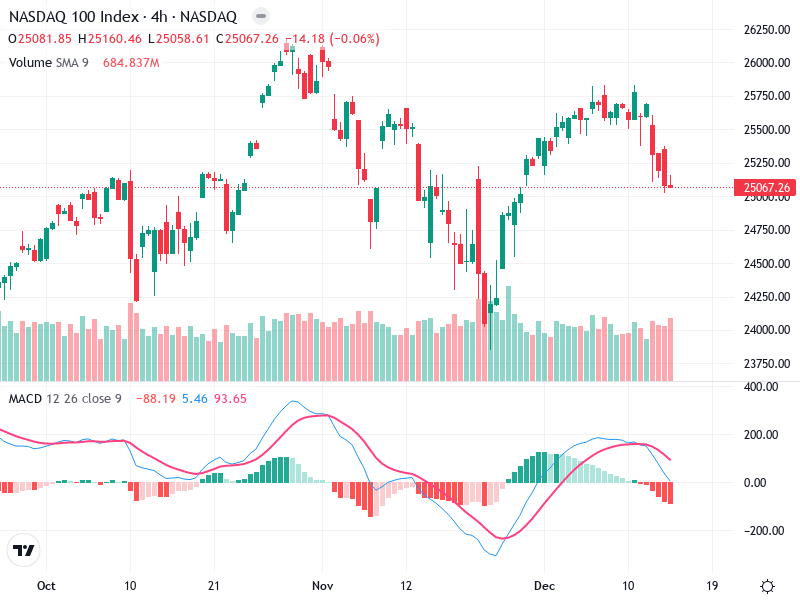
Significant candlestick patterns suggest indecision or potential reversals with formations like dojis and hammers.

The trend is bearish, evident from the series of lower highs and lows, especially in the short term.

Breakout below recent support at 25,000 might lead to more declines, with pullbacks near 25,700 indicating potential resistance.

MACD Analysis

The MACD line crossing below the Signal line confirms a bearish crossover, indicating weakening momentum.

With the histogram below zero and widening, the bearish momentum is reinforced.

No significant divergence seen between MACD and price indicates the current bearish sentiment is strong.

Volume Analysis

Volume has slightly decreased during the downtrend, possibly signaling a lack of conviction in the sell-off.

The current volume does not align strongly with the downward price movement, suggesting potential exhaustion.

No unusual volume spikes observed, which implies the absence of significant institutional activity.

Support & Resistance

Key support is noted around the 25,000 mark, with its breach possibly leading to further declines.

A significant resistance at 25,700 could reverse the trend if approached with strong volume support.

Observing these levels is crucial to anticipate potential reversals and trend breaks.

Actionable Insights

Consider buying if the price rebounds with strong volume at the 25,000 support level.

Selling or shorting can be viable if the 25,000 support is breached with clear downward momentum.

Holding might be suitable if uncertainty continues around current levels without definitive volume cues.

The AI Technical Analysis Center is an informational tool only and does not constitute investment or trading advice.
This site is registered on wpml.org as a development site. Switch to a production site key to remove this banner.