Generic selectors
Exact matches only
Search in title
Search in content
Post Type Selectors

Popular stocks

Crypto

CFD

Currencies

Support

Gold

AUD/USD – Technical Analysis – 4h

December 16, 2025 13:03

Quick Summary

The AUD/USD chart illustrates a mixed sentiment with some elements suggesting potential opportunity. Market indecision reflects in the current sideways movement, awaiting a breakout for direction confirmation. Watch closely for changes in volume and MACD signals since they might cue the next trend direction.

Candlestick Analysis

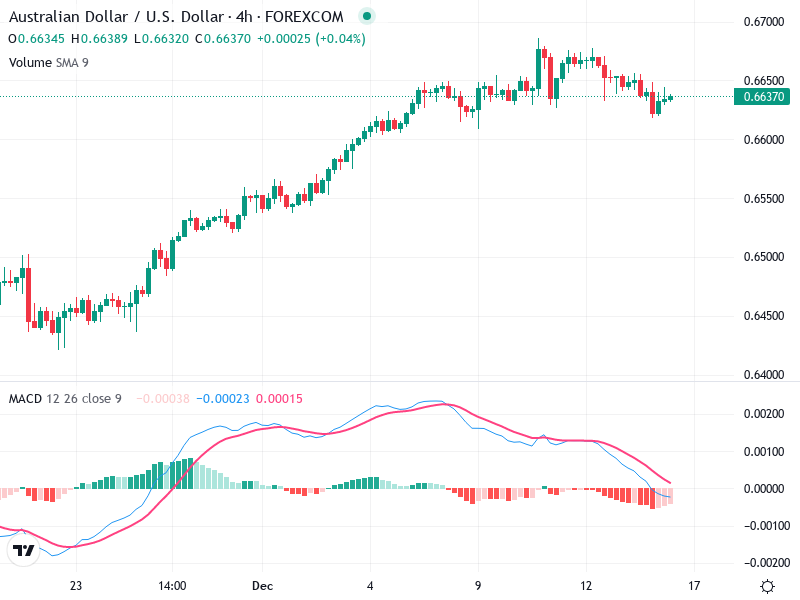
The chart shows a generally bullish trend initially, with higher highs and higher lows, followed by a sideways movement in recent sessions.

There is no obvious bullish or bearish reversal pattern visible, such as a hammer or engulfing pattern, in the latest candles. The recent candles suggest consolidation.

A breakout zone is around 0.6650. A pullback appears to have occurred after reaching around 0.6680.

MACD Analysis

The MACD line is below the Signal line, indicating a bearish crossover that occurred recently.

The histogram is in negative territory with decreasing bars, showing weakening bearish momentum.

There is no clear divergence observed between the MACD and price, with both showing consistent signals.

Volume Analysis

Volume seems to decrease as prices consolidate, typical in a sideways market.

No significant volume spikes that might suggest strong institutional moves or impending large price movement.

This decreased volume often signifies reduced trader activity in the market, which is reflected in the side movement of prices.

Support & Resistance

Resistance is around 0.6680, where the recent high is noted.

Support is around 0.6600, which held as a significant level during recent trading.

Observing movements around these levels could provide potential trading opportunities.

Actionable Insights

Consider holding until a clearer direction is established. Look for a breakout above 0.6680 for bullish entry or a breakdown below 0.6600 for bearish signals.

A bullish MACD crossover or an increase in volume could offer more conviction for a move.

Watch for fake breakouts in this consolidation phase, confirming with volume and MACD momentum.

The AI Technical Analysis Center is an informational tool only and does not constitute investment or trading advice.
This site is registered on wpml.org as a development site. Switch to a production site key to remove this banner.