Generic selectors
Exact matches only
Search in title
Search in content
Post Type Selectors

Popular stocks

Crypto

CFD

Currencies

Support

Gold

GOLD – Technical Analysis – 4h

December 16, 2025 17:02

Quick Summary

The chart is currently showcasing a strong bullish movement, supported by multiple technical indicators. The recent price action suggests continued upward momentum, albeit with some consolidation near key resistance levels.

Currently, the is testing crucial resistance levels, which might determine the subsequent market direction.

Candlestick Analysis

There is a noticeable bullish trend shown by the sequence of higher highs and higher lows.

Recently, there seems to be a formation of a potential reversal pattern with some doji candles indicating indecision near the peak.

The chart shows a strong bullish trend leading up to the current time, but some consolidation is evident at the top.

MACD Analysis

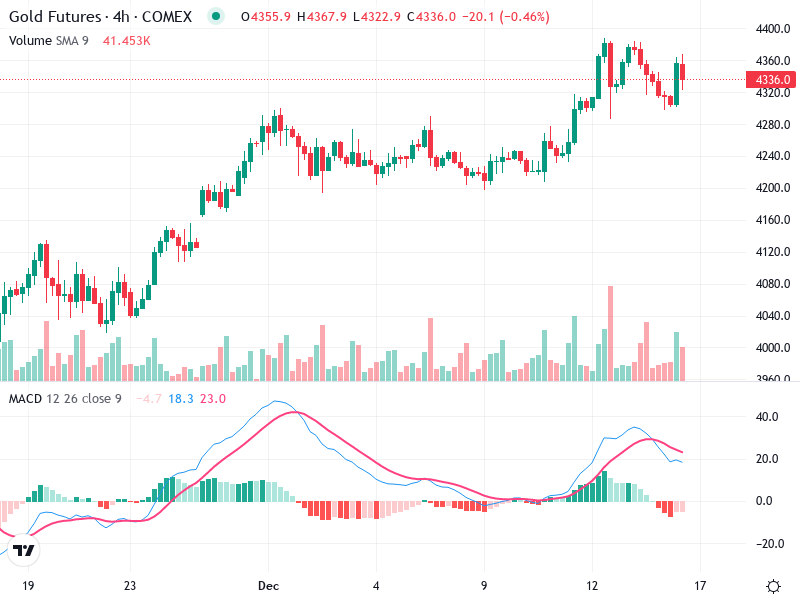
The MACD line has just crossed below the Signal line, indicating a possible bearish divergence and loss of momentum.

The histogram shows decreasing momentum, suggesting that the bullish strength may be waning.

There isn’t an overt divergence between MACD and price action, but the slowing momentum could be indicative of a potential reversal or consolidation phase.

Volume Analysis

The volume increased sharply during the breakout above 4300, supporting the upward movement.

The recent pullback happens on decreasing volume, which can suggest a lack of strong selling pressure.

A few unusually high volume spikes occurred during the rally, likely indicating institutional interest and accumulation.

Support & Resistance

Around 4300, which coincides with the previous breakout point and has acted as a significant level.

Near the recent highs around 4360, which are still being tested as the price consolidates.

Actionable Insights

Consider buying on confirmed breakouts above the recent highs (~4360) if supported by increasing volume.

Be cautious of a sustained break below 4300 on high volume, which may signal a deeper pullback.

If currently positioned long, monitoring for price action confirmation and volume before making additional decisions.

The AI Technical Analysis Center is an informational tool only and does not constitute investment or trading advice.
This site is registered on wpml.org as a development site. Switch to a production site key to remove this banner.