Generic selectors
Exact matches only
Search in title
Search in content
Post Type Selectors

Popular stocks

Crypto

CFD

Currencies

Support

Gold

AUD/USD – Technical Analysis – 4h

December 17, 2025 13:03

Quick Summary

The 4-hour chart of AUD/USD reveals a detailed interplay between technical indicators and market sentiment. Despite recent bearish movements, the chart provides insights into potential breakthroughs and key levels to watch.

The asset’s price action, along with volume and MACD indicators, guides traders in identifying possible trend reversals and momentum shifts.

Candlestick Analysis

The chart shows an overall uptrend initially, followed by a sideways movement and some recent bearish activity.

Several small-bodied candles indicate indecision in the market.

A potential bearish engulfing pattern is visible before the recent downtrend, suggesting a reversal from the previous uptrend.

MACD Analysis

The MACD line is below the Signal line, indicating a bearish crossover. This suggests bearish momentum.

The histogram shows negative values, reflecting increasing bearish momentum. However, a decreasing histogram size might indicate weakening bearish momentum.

There are no apparent divergences between MACD and price action, as both are showing bearish tendencies.

Volume Analysis

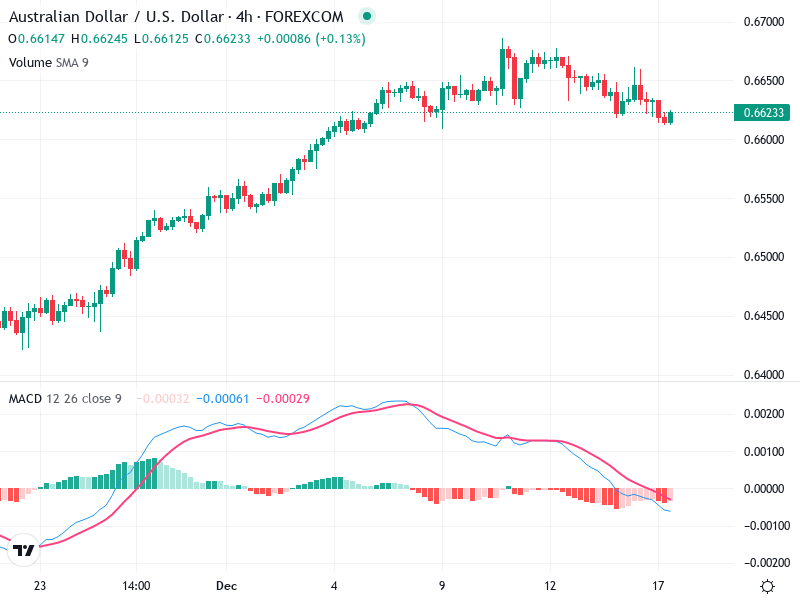
The volume appears to be decreasing during the recent sideways and downtrend, which might suggest a lack of strong conviction in the bearish movement.

No unusual spikes in volume, indicating the absence of significant institutional activity in the recent sessions.

Overall, the volume analysis suggests cautious trading behavior, with a wait-and-see approach by larger market players.

Support & Resistance

Around the 0.6650 level, where the price recently turned lower, acts as a resistance.

A key support zone is around 0.6600, which could act as a potential bounce area if tested.

These levels are crucial for future price action, providing potential entry or exit points for traders.

Actionable Insights

If the price breaks below the 0.6600 support level with increased volume, it may confirm further bearish movement.

Until clear confirmation of a directional move, consider holding given the current indecisive market sentiment.

Watch for increased volume with a clear breakout above 0.6650 or below 0.6600 for confirmation of the next directional trend.

The AI Technical Analysis Center is an informational tool only and does not constitute investment or trading advice.
This site is registered on wpml.org as a development site. Switch to a production site key to remove this banner.