Generic selectors
Exact matches only
Search in title
Search in content
Post Type Selectors

Popular stocks

Crypto

CFD

Currencies

Support

Gold

EUR/USD – Technical Analysis – 4h

December 18, 2025 08:02

Quick Summary

The chart reveals a recent consolidation phase following a strong upward trend. Current candlestick patterns suggest potential reversals are on the horizon, especially at key resistance and support levels.

Despite a previous bullish momentum, MACD indicators and volume analysis reveal a cautious sentiment, indicating potential losses in bullish strength. Key levels at 1.1700 and 1.1750 play vital roles in upcoming market decisions.

Candlestick Analysis

Observe the small-bodied candles with long wicks recently, indicating indecision and potential reversals, possibly resembling doji patterns.

The previous sharp upward movement shows bullish sentiment, but current candles suggest a pause or consolidation phase.

The level around 1.1700 could serve as a short-term support.

MACD Analysis

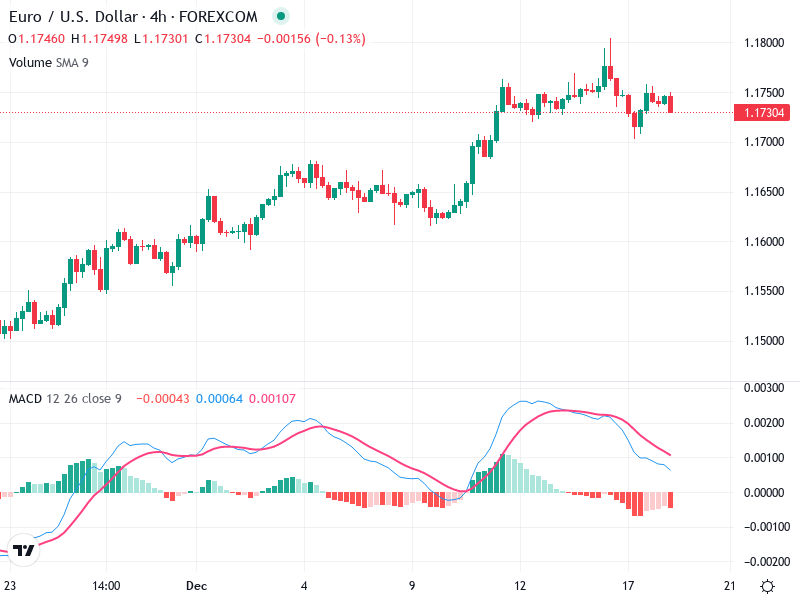
The MACD line crossed below the Signal line, indicating a bearish crossover has occurred, suggesting loss of bullish momentum.

The histogram shows decreasing bars, supporting the bearish crossover pointing towards waning bullish momentum.

No clear divergence between the MACD and price action, but the bearish crossover cautions against bullish positions without further support.

Volume Analysis

Recent volume spikes suggest potential institutional trading activities but aren't significantly trending upwards to support continued bullishness.

Volume is not strongly aligned with price movements, indicating caution for further upside without stronger volume confirmation.

Notable spikes in early December's rally but have since moderated, indicating reduced buying enthusiasm.

Support & Resistance

Support at approximately 1.1700, seeing price respect and bounce.

Resistance near 1.1750, creating a short-term ceiling that needs to break for further upside.

Breaking above 1.1750 with volume could signal a new bullish leg, while losing 1.1700 may accelerate downside pressure.

Actionable Insights

Consider buying above 1.1750 with confirmation from volume and MACD bullish crossover.

Sell below 1.1700 if selling pressure and volume increase.

Hold within the 1.1700 - 1.1750 range until clearer signals emerge.

The AI Technical Analysis Center is an informational tool only and does not constitute investment or trading advice.
This site is registered on wpml.org as a development site. Switch to a production site key to remove this banner.