Generic selectors
Exact matches only
Search in title
Search in content
Post Type Selectors

Popular stocks

Crypto

CFD

Currencies

Support

Gold

AUD/USD – Technical Analysis – 4h

December 18, 2025 13:02

Quick Summary

The AUD/USD 4-hour chart shows a recent stabilization following a downward trend. Current patterns suggest a potential neutral to bearish sentiment.

Traders are closely monitoring key support and resistance levels for future price direction.

Candlestick Analysis

No prominent candlestick patterns like bullish engulfing or hammer are evident around the current price action.

Recent candles indicate potential stabilization after a downtrend.

The chart shows an initial bullish trend transitioning into a bearish correction, with recent price action suggesting potential sideways movement.

MACD Analysis

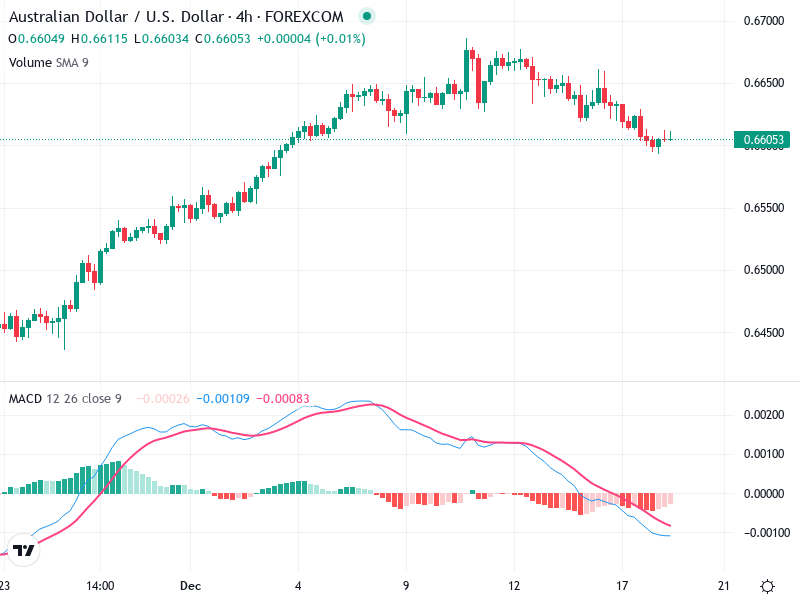
The MACD line is below the Signal line, suggesting bearish momentum, but convergence might indicate weakening bearish trend.

The MACD histogram shows reducing negative bars, hinting at decreased bearish momentum.

No clear divergence is observed between MACD and price action, maintaining the bearish sentiment.

Volume Analysis

Volume slightly decreases as the price consolidates, typical of market stabilization post-trend.

Decreasing volume during consolidation suggests a pause in the bearish trend rather than strong buying interest.

No significant volume spikes evident, signaling the absence of aggressive buying or selling by major traders.

Support & Resistance

Immediate support level is around 0.6600, which requires monitoring for potential breakdowns.

Key resistance level near 0.6650 where previous highs were rejected.

Breaching these levels could lead to significant moves as they have been recent minor consolidation zones.

Actionable Insights

Consider buying if the price breaks above 0.6650 with confirming volume increase and bullish MACD crossover.

Selling opportunities may present if the price breaks below 0.6600 with increased volume and further bearish MACD divergence.

Holding is advisable until a clear breakout direction is confirmed by current indicators.

The AI Technical Analysis Center is an informational tool only and does not constitute investment or trading advice.
This site is registered on wpml.org as a development site. Switch to a production site key to remove this banner.