Generic selectors
Exact matches only
Search in title
Search in content
Post Type Selectors

Popular stocks

Crypto

CFD

Currencies

Support

Gold

OIL – Technical Analysis – 4h

December 18, 2025 17:01

Quick Summary

The 4-hour chart of Crude Oil Futures indicates potential shifts in momentum. Recent patterns suggest a possible shift from bearish trends, though confirmation is required by key levels.

The asset shows signs of consolidation, hinting at a possible bullish reversal if certain conditions are met.

Candlestick Analysis

The chart shows a recent bearish trend with a series of lower highs and lower lows. However, there is a potential shift as recent candles suggest consolidation.

A hammer-like candlestick appears on the far right, which may indicate a potential reversal or support near the $56.00 level.

Earlier, doji patterns suggest indecision and possible consolidation zones.

MACD Analysis

The MACD line has crossed above the Signal line, indicating a bullish crossover which suggests potential bullish momentum building.

The histogram shows decreasing bearish momentum and a shift towards the positive side, supporting a bullish outlook.

No clear divergence is visible between the MACD and price action, aligning current minor bullish signs with the MACD.

Volume Analysis

There has been a significant increase in volume aligned with the recent price moves, indicating strong interest and participation.

Increased volume on the latest upward movements supports the bullish crossover seen on the MACD.

No unusual spikes suggest unexpected institutional activity, but sustained volume increment may indicate growing interest.

Support & Resistance

The $56.00 level is crucial, acting as immediate support marked by recent consolidation and hammer candlestick.

First resistance appears near $57.00, with more robust resistance near $58.00 if the price manages to break above.

Actionable Insights

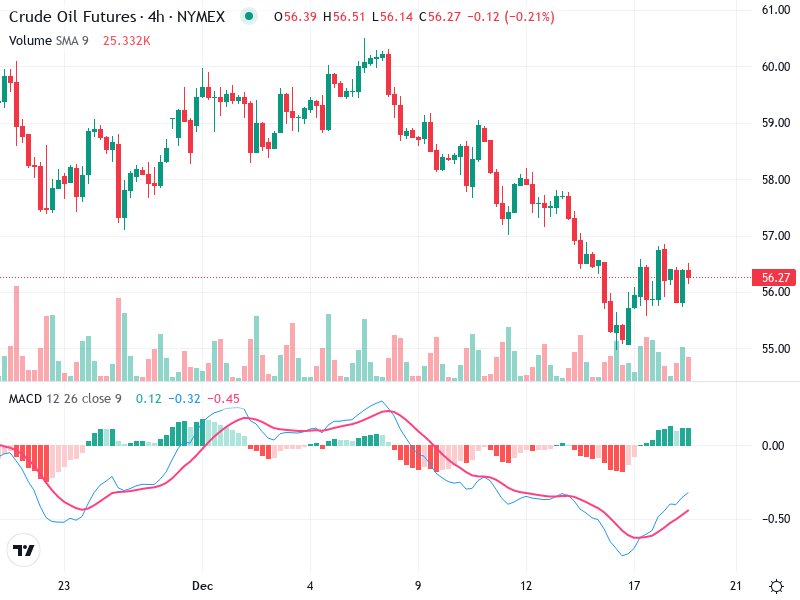
Consider buying on a confirmed breakout above $57.00 with supporting volume, aiming for targets near $58.00-$59.00.

A break below $56.00 with increased selling volume may be a signal to sell or short, targeting lower support levels near $55.00.

Given the current consolidation, holding may be wise until a clearer trend emerges, monitoring key support and resistance.

The AI Technical Analysis Center is an informational tool only and does not constitute investment or trading advice.
This site is registered on wpml.org as a development site. Switch to a production site key to remove this banner.