Generic selectors
Exact matches only
Search in title
Search in content
Post Type Selectors

Popular stocks

Crypto

CFD

Currencies

Support

Gold

EUR/USD – Technical Analysis – 4h

December 19, 2025 08:03

Quick Summary

The EURO /U.S. Dollar 4-hour chart displays a recent sideways movement following a previous bullish trend. The asset is approaching key support levels that may influence future price action. Watch for breakout signals as they might dictate upcoming market moves.

Candlestick Analysis

The overall trend up to mid-December shows a bullish movement, followed by a recent sideway trend with a slight bearish inclination.

There isn't a clear significant candlestick pattern like a bullish engulfing or doji at the current position.

The recent candles suggest indecision and a potential shift in momentum.

MACD Analysis

The MACD line (blue) is below the signal line (red), indicating a bearish crossover has occurred recently.

The MACD histogram is in negative territory, suggesting bearish momentum is still present but could be waning.

There is no apparent divergence between MACD and price action, which typically reinforces the current trend direction.

Volume Analysis

No significant volume spikes are visible in the recent candles, indicating lack of strong buying or selling pressure.

The decline in price is not accompanied by increasing volume, which could suggest the bearish move lacks strong conviction.

The volume remains around average; there is no clear indication of institutional activity.

Support & Resistance

The area around 1.1800 acts as a strong resistance level, where previous highs were rejected.

The current level at 1.1700 serves as a potential support zone.

Further drops could test support around 1.1650 or even lower towards 1.1600.

Actionable Insights

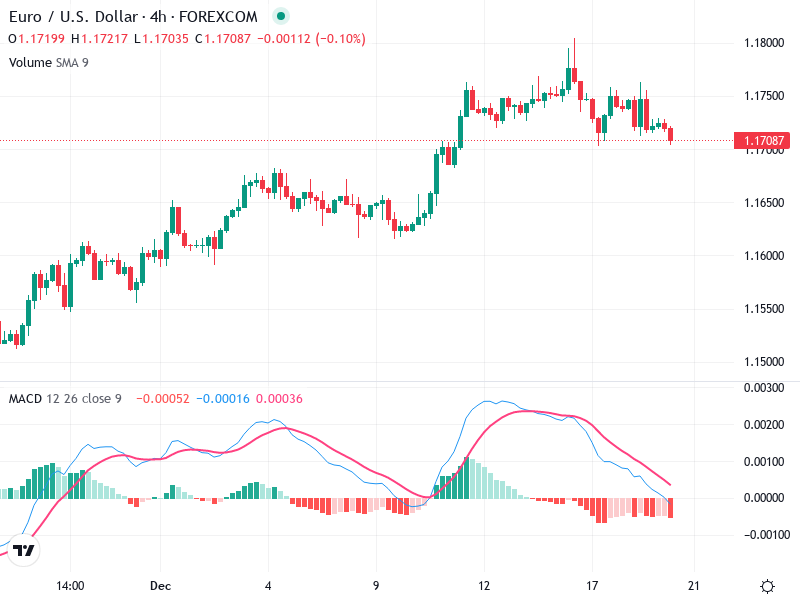
Consider buying if there is a bullish reversal pattern near the 1.1700 support level, with confirmation from increasing volume and MACD turning positive.

Selling could be considered if 1.1700 support is decisively broken, confirmed by increased volume and continued negative MACD.

For those already holding, it’s advisable to wait for a clear signal (e.g., MACD turning bullish or confirming a break below support).

The AI Technical Analysis Center is an informational tool only and does not constitute investment or trading advice.
This site is registered on wpml.org as a development site. Switch to a production site key to remove this banner.