Generic selectors
Exact matches only
Search in title
Search in content
Post Type Selectors

Popular stocks

Crypto

CFD

Currencies

Support

Gold

AUD/USD – Technical Analysis – 4h

December 19, 2025 13:03

Quick Summary

The AUD/USD chart reveals a shift in trend from bullish to bearish, with initial upward momentum giving way to consolidation. Watch for potential reversals.

The asset is testing key support and resistance levels, providing an opportunity for trend analysis.

Candlestick Analysis

The overall trend appears to be changing from bullish to bearish. There's a clear uptrend initially, but recent price action suggests a consolidation and potential reversal.

There are no strong candlestick patterns like a bullish engulfing or hammer visible in the current image. However, the smaller candlesticks near the end may suggest indecision or a slowdown in momentum.

A pullback from recent highs around 0.6700 indicates possible exhaustion of the prior bullish trend.

MACD Analysis

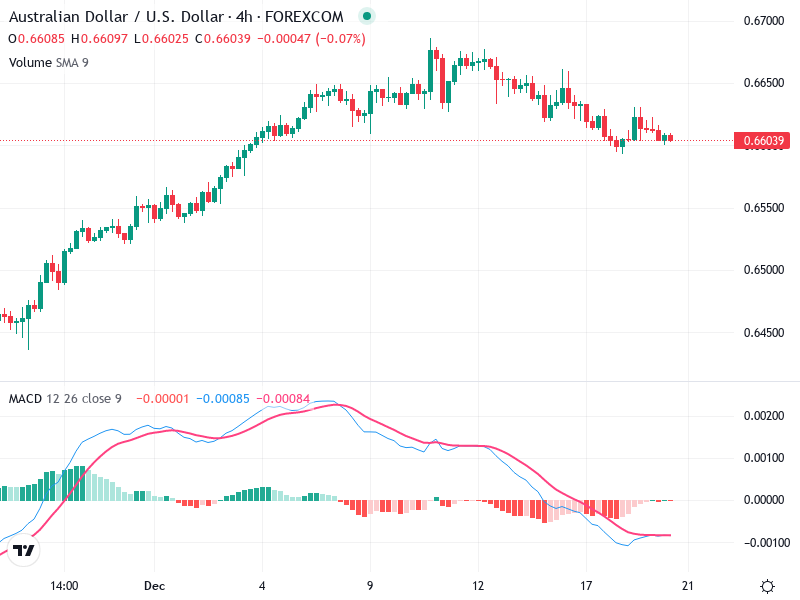
Currently, the MACD line is below the Signal line, suggesting bearish momentum. The crossover is a bearish signal for short-term price movement.

The MACD histogram shows negative values, supporting the bearish momentum. A reduction in the histogram's length might indicate a potential slowdown in bearish momentum.

There is no clear divergence between the MACD and price action at this time.

Volume Analysis

There is no significant volume spike visible, indicating a lack of strong institutional activity. The volume remains consistent, which does not contradict the current trend.

The steady volume level supports the notion that the recent pullback is part of a normal correction rather than a sharp trend reversal.

The overall volume trend needs careful monitoring for signs of increased buying or selling pressure.

Support & Resistance

Key support seems to be around the 0.6600 mark, where the price is currently hovering.

The recent high near 0.6700 serves as a potential resistance zone. Break above this level could resume a bullish trend.

Monitoring these levels is crucial for anticipating potential breakouts or reversals.

Actionable Insights

Given the bearish crossover in MACD and proximity to support, investors might consider short positions if the price convincingly falls below 0.6600 with higher volume.

Watch for confirmation from a sustained increase in volume and further bearish price action. A bullish reversal signal might be considered if the price breaks above 0.6700 with strong momentum.

Caution is advised, with a focus on watching key levels and waiting for confirming signals before taking actions.

The AI Technical Analysis Center is an informational tool only and does not constitute investment or trading advice.
This site is registered on wpml.org as a development site. Switch to a production site key to remove this banner.