Generic selectors
Exact matches only
Search in title
Search in content
Post Type Selectors

Popular stocks

Crypto

CFD

Currencies

Support

Gold

EUR/USD – Technical Analysis – 4h

December 22, 2025 08:02

Quick Summary

The EURO /U.S. Dollar chart shows a period of consolidation following an initial uptrend.

Key levels of support and resistance are evident, but market indecision persists.

Candlestick Analysis

The market shows an uptrend initially, followed by a consolidation phase around the 1.17500 level.

There are no clear strong candlestick reversal patterns recently, but a doji appears in the consolidation area, suggesting potential indecision in the market.

A breakout occurred above 1.17000, which has acted as a support during the consolidation phase.

MACD Analysis

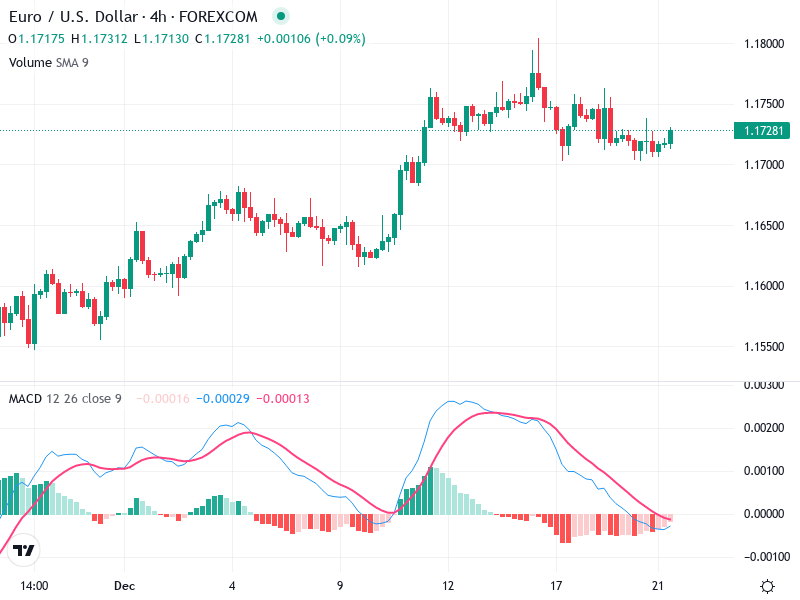
The MACD line is below the Signal line, indicating a bearish sentiment. However, they are converging, which could suggest a potential bullish crossover if momentum picks up.

The MACD histogram shows decreasing bearish momentum, reflecting potential weakening of the downtrend within the consolidation phase.

No significant divergences observed between MACD and price action at the moment.

Volume Analysis

Volume appears relatively stable but slightly diminishes during the consolidation phase, typical for sideways markets.

The decrease in volume during consolidation does not support any strong breakout or breakdown, implying cautious market behavior.

No significant spikes indicating institutional activity.

Support & Resistance

Around 1.17000, which has held multiple tests during consolidation.

The area near 1.17500, previously a peak, might act as strong resistance if the price attempts an upward move.

Actionable Insights

Consider entering long positions if there is a bullish MACD crossover complemented by a breakout above 1.17500 with increased volume.

Be cautious of a breakdown below 1.17000 as it may lead to further downward movement, especially if supported by an increase in bearish volume.

Current consolidation suggests holding existing positions and observing for strong price-action signals before making new trades.

The AI Technical Analysis Center is an informational tool only and does not constitute investment or trading advice.
This site is registered on wpml.org as a development site. Switch to a production site key to remove this banner.