Generic selectors
Exact matches only
Search in title
Search in content
Post Type Selectors

Popular stocks

Crypto

CFD

Currencies

Support

Gold

AUD/USD – Technical Analysis – 4h

December 22, 2025 13:03

Quick Summary

The chart for the Australian Dollar indicates a possible bullish continuation.

This is supported by recent candlestick patterns and increased volume.

The analysis also highlights a bullish crossover in the MACD indicator.

Candlestick Analysis

A significant bullish engulfing pattern was recently observed, suggesting a potential reversal from a previous downtrend.

The overall trend appears to be reversing to bullish after a period of consolidation.

The price is nearing potential breakout zones around the 0.6647 level, indicating a need to watch for a sustained move above this point for confirmation.

MACD Analysis

A bullish crossover has happened, with the MACD line crossing above the Signal line, reflecting bullish momentum.

The MACD histogram is entering positive territory, suggesting strengthening upward momentum.

No significant divergences are currently noted.

Volume Analysis

There has been a noticeable rise in volume accompanying the recent price increase, which supports the bullish price action.

The recent volume surge suggests heightened interest, possibly indicative of institutional activity.

The relationship between volume and price action is pivotal for confirming the overall market sentiment.

Support & Resistance

Key support is identified around the 0.6570 level, serving as a potential entry point if tested.

Resistance is present around the 0.6647 level, and a breach of this resistance could lead to further upside.

Monitoring how price reacts at these levels will be crucial for determining the strength of the current trend.

Actionable Insights

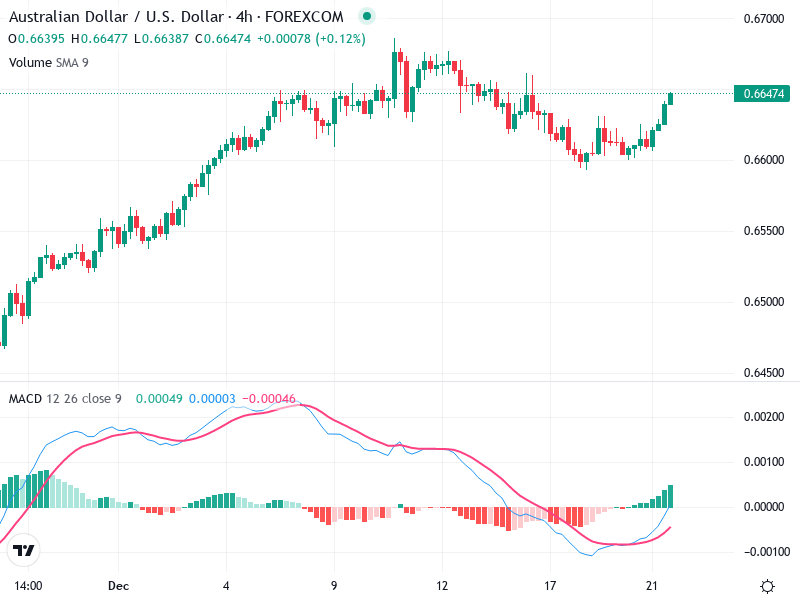
Consider entering a long position upon a confirmed breakout above the 0.6647 resistance level, particularly if accompanied by strong volume.

Watch for confirmation signals such as a sustained close above resistance, along with continued volume support.

Exercise caution regarding false breakouts, which could lead to premature positioning.

The AI Technical Analysis Center is an informational tool only and does not constitute investment or trading advice.
This site is registered on wpml.org as a development site. Switch to a production site key to remove this banner.