Generic selectors
Exact matches only
Search in title
Search in content
Post Type Selectors

Popular stocks

Crypto

CFD

Currencies

Support

Gold

EUR/USD – Technical Analysis – 4h

December 23, 2025 08:03

Quick Summary

The EUR/USD 4-hour chart reveals a bullish trend with the price consistently making higher highs and higher lows. The current technical indicators suggest potential continued upward momentum. Monitoring key levels and market indicators is crucial for making informed trading decisions.

Candlestick Analysis

There is a noticeable bullish engulfing pattern around mid-December, indicating a potential reversal or continuation of the uptrend.

Recent candlesticks suggest bullish momentum with predominantly green candles leading into the current price level.

The chart shows a bullish trend. The price has been making higher highs and higher lows since early December.

MACD Analysis

The MACD line has crossed above the Signal line, suggesting a bullish crossover. This indicates a potential buy signal.

The histogram is showing increasing positive momentum, reinforcing the bullish sentiment.

No significant divergence between MACD and price action at the moment. Both are aligned upwards.

Volume Analysis

Volume appears to be steady with occasional spikes. A recent increase in volume corresponds with the bullish price action, supporting the strength of the current upward trend.

No clear indication of extraordinary volume spikes suggesting institutional activity in the recent timeframe.

An increase in volume at key chart points strengthens the case for a bullish continuation.

Support & Resistance

Key support is observed around 1.1700. This level may act as a buffer against downward price movements.

Immediate resistance is at the 1.1775 level, which is currently being tested. Breaking this level could lead to further gains.

Observing price action around these levels can provide insights into potential trend reversals or continuations.

Actionable Insights

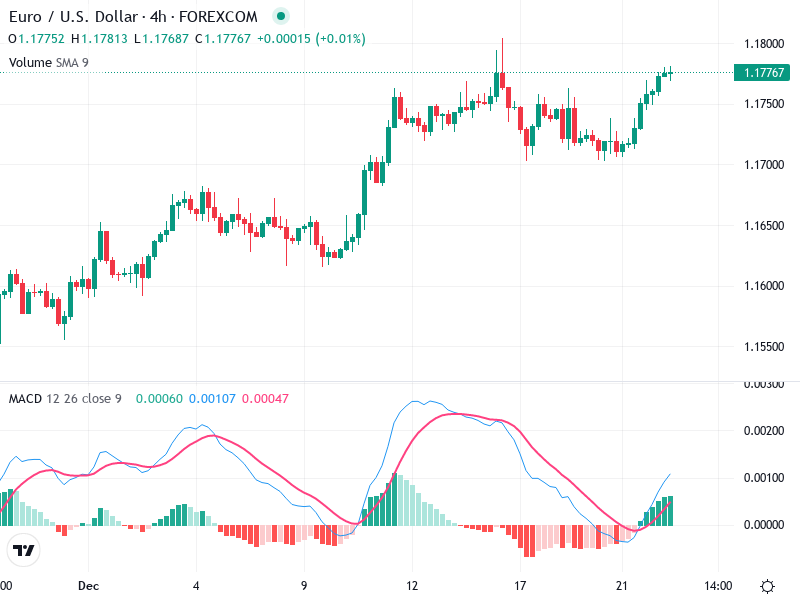
Consider buying if the price closes above 1.1775 on strong volume, confirming a breakout.

Be cautious for potential pullbacks if the price fails to break resistance and observe a downtrend starting at the current level.

Holding existing positions could be beneficial, considering the overall bullish structure, unless a breakdown occurs below key support (1.1700).

The AI Technical Analysis Center is an informational tool only and does not constitute investment or trading advice.
This site is registered on wpml.org as a development site. Switch to a production site key to remove this banner.