Generic selectors
Exact matches only
Search in title
Search in content
Post Type Selectors

Popular stocks

Crypto

CFD

Currencies

Support

Gold

OIL – Technical Analysis – 4h

December 23, 2025 17:01

Quick Summary

The Crude Oil Futures (4h Chart) have been showcasing a shift in momentum. Recently, an upward trend has been observed, breaking the previous resistance level. Technical indicators suggest that this asset has potential for continued growth.

Candlestick Analysis

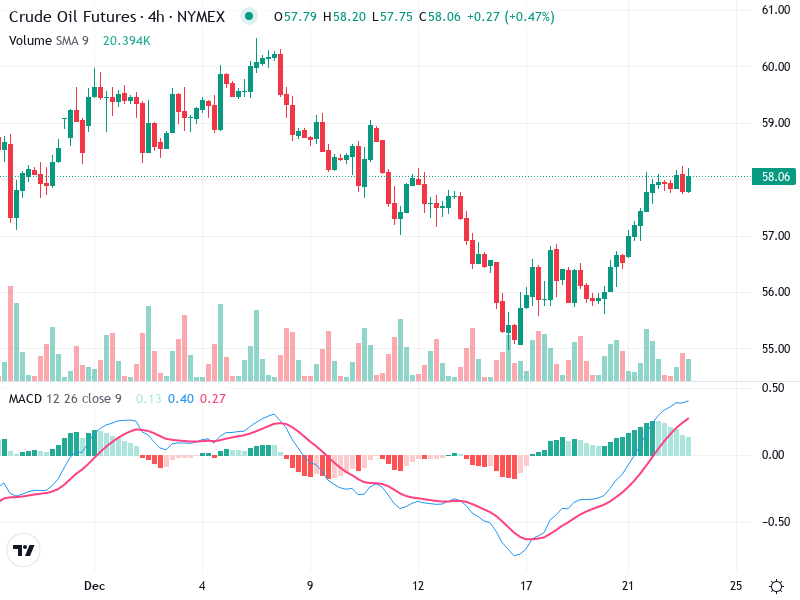
Recently, there appears to be a bullish candlestick pattern with a series of green candles following a previous downtrend, suggesting a potential reversal.

The trend has shifted from bearish to bullish in the short term, with recent candles showing higher highs and higher lows.

The breakout seems to have occurred around the $56.00 level, moving towards the current level of $58.06.

MACD Analysis

The MACD line is above the Signal line, indicating a bullish crossover which suggests growing bullish momentum.

The histogram is positive and increasing, supporting the bullish sentiment.

No significant divergences are visible between the MACD and price action currently.

Volume Analysis

The volume increased during the recent upward price movement, which is a confirmation of the bullish trend.

The rise in volume during price increases suggests strong support for the bullish move.

There are no exceptionally unusual spikes indicative of strong institutional activity beyond what supports the price rise.

Support & Resistance

Key support is near the $56.00 level, which was the previous resistance turned support.

Current resistance seems to be around $59.00, where previous price peaks occurred.

These levels are crucial for identifying potential reversal points or breakouts for further price movement.

Actionable Insights

Traders could consider buying if the price holds above the $56.00 support level with continued volume support.

Consider selling or shorting if the price approaches the $59.00 resistance and fails to break through, potentially with a confirmation of decreased volume.

Holding may be suitable if already in a position, with a watchful eye on the $59.00 resistance for potential breakouts or reversals.

The AI Technical Analysis Center is an informational tool only and does not constitute investment or trading advice.
This site is registered on wpml.org as a development site. Switch to a production site key to remove this banner.