Generic selectors
Exact matches only
Search in title
Search in content
Post Type Selectors

Popular stocks

Crypto

CFD

Currencies

Support

Gold

GOLD – Technical Analysis – 4h

December 23, 2025 17:02

Quick Summary

The gold Futures chart indicates a strong upward trend. The price has recently broken through resistance, suggesting bullish momentum. The asset’s movement is supported by increased volume.

Candlestick Analysis

The overall trend appears bullish with a series of higher highs and higher lows.

There is no strong reversal pattern visible. However, some small consolidation zones can be seen, which acted as minor pullback areas before resuming the upward trend.

A recent breakout is observed past the resistance zone around 4450, leading to a quick spike toward 4500.

MACD Analysis

The MACD line (blue) is above the Signal line (red), indicating a bullish crossover. This suggests strong positive momentum in the current price trend.

The histogram bars are expanding, supporting increasing bullish momentum.

No significant divergence between MACD and price is evident. The MACD supports the observed price action trend.

Volume Analysis

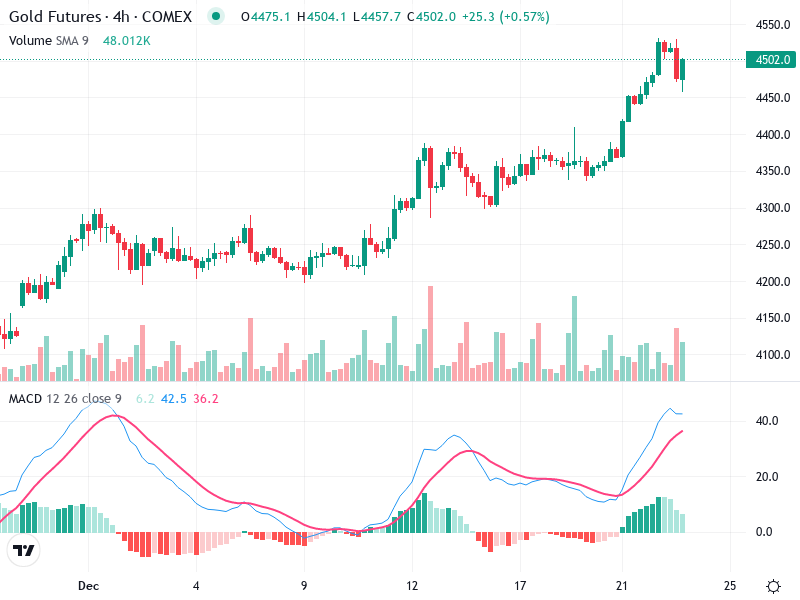
There has been an increase in volume accompanying the recent upward price movement, which validates the bullish momentum.

The spikes in volume, especially during the price surge past 4450, could indicate institutional buying.

Overall, volume trends support the bullish sentiment.

Support & Resistance

Key support can be noted around the 4350 level, where previous highs could provide a floor.

The recent high of around 4500 may act as a resistance, with potential profit-taking occurring near this level.

Monitoring these levels may help identify buying and selling opportunities.

Actionable Insights

Consider buying on dips towards the support level at 4350, with confirmation of continued bullish signs.

Keep an eye for potential resistance near 4500 for short-term profit-taking or setting stop-loss levels if you're already long.

The current trend suggests holding existing long positions unless there are signs of a strong reversal or bearish indicators develop.

The AI Technical Analysis Center is an informational tool only and does not constitute investment or trading advice.
This site is registered on wpml.org as a development site. Switch to a production site key to remove this banner.