Generic selectors
Exact matches only
Search in title
Search in content
Post Type Selectors

Popular stocks

Crypto

CFD

Currencies

Support

Gold

EUR/USD – Technical Analysis – 4h

December 24, 2025 08:02

Quick Summary

The 4-hour chart of EUR/USD exhibits a bullish trend, highlighted by higher highs and higher lows.

Despite the bullish momentum, potential consolidation is suggested by recent candlestick formations.

Key resistance and support levels will be crucial for future price action.

Candlestick Analysis

The overall trend is bullish as evidenced by the series of higher highs and higher lows.

A bullish engulfing pattern appeared earlier in the trend, indicating continued upward momentum.

Recent candlesticks show indecision with a slight bearish pullback, hinting at short-term consolidation.

MACD Analysis

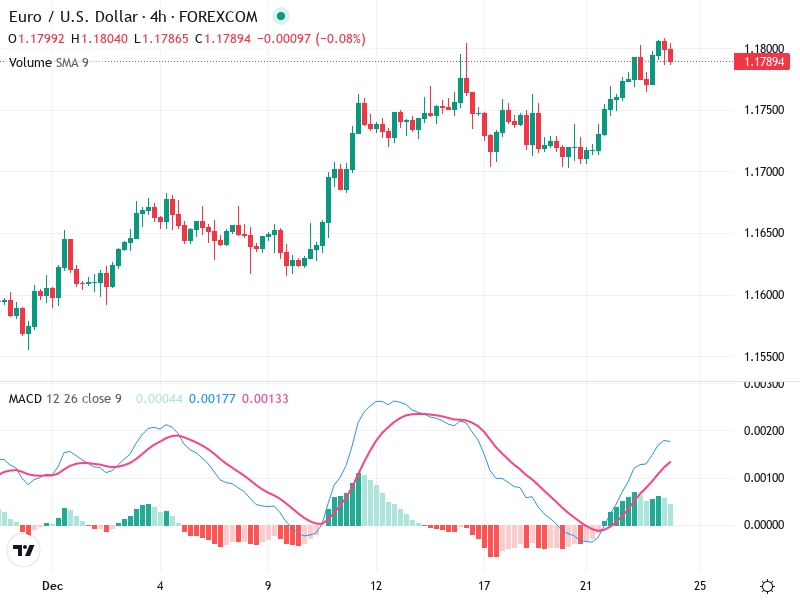
The MACD line has recently crossed above the Signal line, indicating bullish momentum. However, the lines are narrowing, suggesting weakening momentum.

The histogram is above the zero line but shows decreasing bars, implying reduced bullish momentum.

No clear divergences are visible, indicating price action aligns with MACD readings.

Volume Analysis

Volume is stable, with no significant spikes indicating strong institutional activity.

The upward moves earlier in the chart were accompanied by increased volume, supporting bullish sentiment.

No unusual volume patterns, suggesting moves align with average trading activity.

Support & Resistance

The 1.1800 level is acting as resistance, and a break above could signal further bullish momentum.

Immediate support is around 1.1780, and a break below could indicate a bearish correction.

Monitoring these levels is essential for future price action decisions.

Actionable Insights

Consider buying if the price breaks and holds above 1.1800, confirmed by increased volume and widening MACD.

Consider selling if the price breaks below 1.1780 support level, especially if accompanied by a bearish MACD crossover.

Monitor for emerging patterns near key levels for clearer directional signals.

The AI Technical Analysis Center is an informational tool only and does not constitute investment or trading advice.
This site is registered on wpml.org as a development site. Switch to a production site key to remove this banner.