Generic selectors
Exact matches only
Search in title
Search in content
Post Type Selectors

Popular stocks

Crypto

CFD

Currencies

Support

Gold

NZD/USD – Technical Analysis – 4h

December 24, 2025 13:00

Quick Summary

The chart for Asset shows a strong bullish trend, as evidenced by various technical indicators. The recent breakout past the resistance level suggests potential for continued upward movement.

The chart displays ongoing momentum, with key levels being respected, supported by both volume and MACD trends.

Candlestick Analysis

A notable bullish engulfing pattern is observed, indicating strong buying interest and potential upward momentum.

Recent candlesticks suggest consolidation with smaller bodies, hinting at indecision or a potential pause before a move.

The chart displays a bullish trend with higher highs and higher lows.

MACD Analysis

The MACD line is above the Signal line, indicating a bullish crossover suggesting continued upward momentum.

The histogram is positive and increasing, reflecting strengthening bullish momentum.

No significant divergence between the MACD and price action aligns with the present trend.

Volume Analysis

There was an increase in volume during the breakout around the 0.5800 level, supporting the bullish move.

The increased volume aligns with the price movement upward and confirms the breakout's validity.

No extraordinary volume spikes suggestive of institutional activity observed currently.

Support & Resistance

Key support is now likely around the 0.5800 level, where the previous resistance was broken.

Immediate resistance can be seen near the recent highs, roughly around the 0.5860 area.

Monitoring these levels is crucial for identifying future price movements.

Actionable Insights

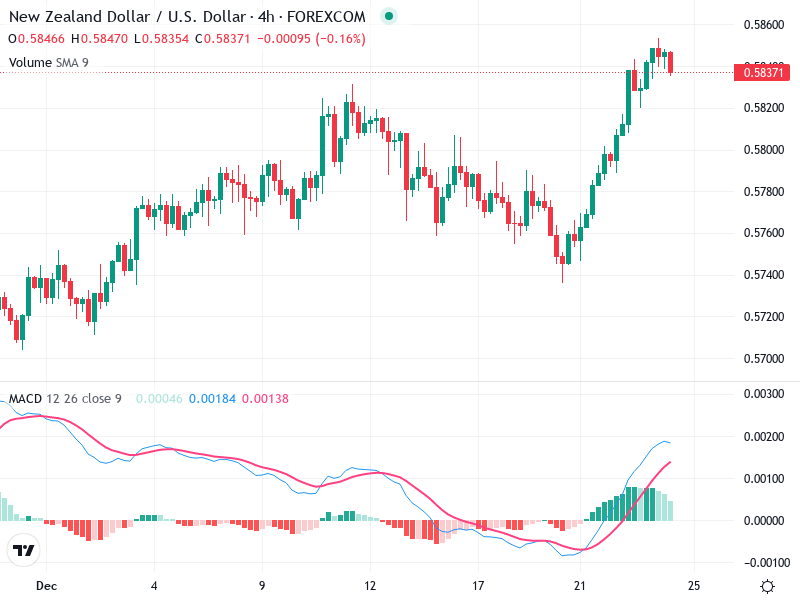
Consider buying on pullbacks near support levels such as 0.5800, with an eye on bullish continuation patterns.

Selling could be considered if price action shows reversal signs near resistance at 0.5860.

Current holders might maintain positions with tight stop-losses set below 0.5800, given the strong upward trend confirmation.

The AI Technical Analysis Center is an informational tool only and does not constitute investment or trading advice.
This site is registered on wpml.org as a development site. Switch to a production site key to remove this banner.