Generic selectors
Exact matches only
Search in title
Search in content
Post Type Selectors

Popular stocks

Crypto

CFD

Currencies

Support

Gold

GOLD – Technical Analysis – 4h

December 24, 2025 17:03

Quick Summary

This analysis provides insights into the technical state of gold Futures on a 4-hour chart. Recent patterns indicate potential changes in momentum. The asset shows mixed signals, with bullish trends but some bearish factors to consider.

Candlestick Analysis

Recently, a potential bearish engulfing pattern formed, indicating possible downward pressure.

Prior to this, several strong bullish candles contributed to a robust upward trend.

The price has pulled back from a high around 4560, which may act as a resistance level.

MACD Analysis

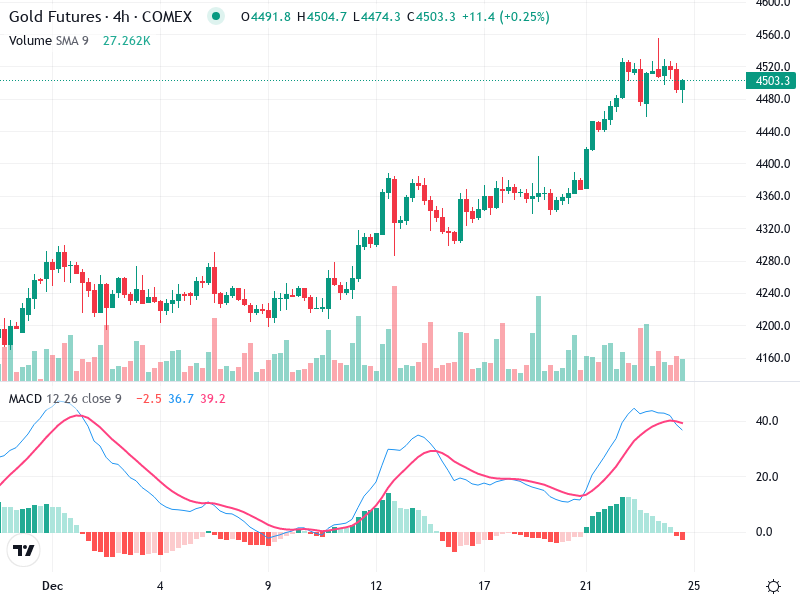
Currently, the MACD line is above the Signal line, although it is curving downwards, suggesting a potential bearish crossover.

The histogram shows decreasing bullish momentum, aligning with the pullback in price.

No significant divergences between the MACD and price action are currently evident.

Volume Analysis

A noticeable increase in volume occurred alongside the recent rally, supporting the price increase.

The volume uptick during bullish phases confirms strong buying interest.

Volume spikes align with significant price movements, hinting at possible institutional participation.

Support & Resistance

The area around 4560 has emerged as a resistance point.

Strong support is identified around 4420.

If the support level of 4420 is breached, a more significant correction might ensue.

Actionable Insights

Consider buying on confirmation of support at 4420.

A bearish crossover in the MACD could signal a selling opportunity.

Holding may be advisable unless significant support/resistance levels are broken with confirmation.

The AI Technical Analysis Center is an informational tool only and does not constitute investment or trading advice.
This site is registered on wpml.org as a development site. Switch to a production site key to remove this banner.