Generic selectors
Exact matches only
Search in title
Search in content
Post Type Selectors

Popular stocks

Crypto

CFD

Currencies

Support

Gold

OIL – Technical Analysis – 4h

December 25, 2025 17:00

Quick Summary

The Crude Oil Futures chart shows a transition from initial bearishness to a bullish trend as prices recover from a significant low.

The upward momentum appears to be influenced by potential bullish patterns and supportive volume signals.

Candlestick Analysis

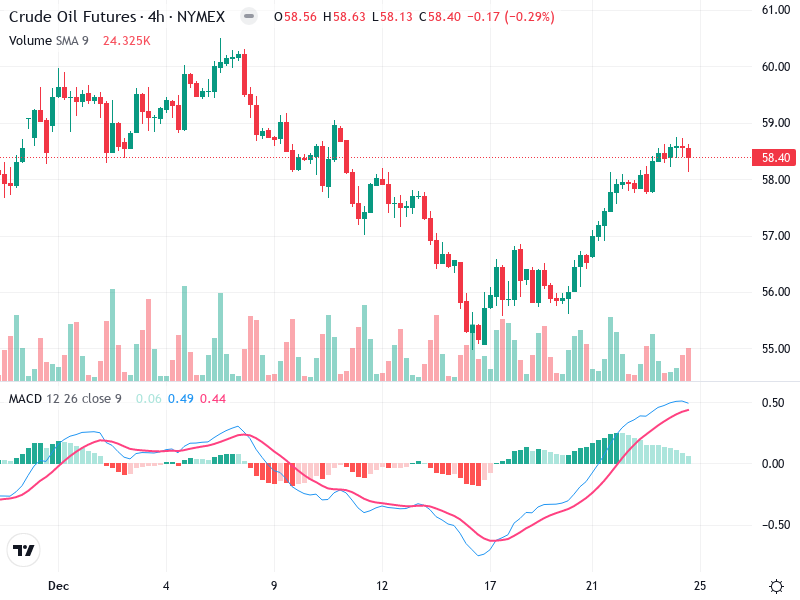
The overall trend on the chart displays an initial bearish movement which transitions to a bullish trend in the mid-section, with prices climbing after hitting a low.

After a prolonged downtrend, a potential hammer pattern appears at the bottom around December 16, indicating a possible bullish reversal, which is confirmed by the subsequent upward move.

The resistance around the $58.50-$59 area is being tested, indicating a potential breakout or pullback zone, which aligns with the current price level.

MACD Analysis

The MACD line (blue) crossed above the Signal line (red) recently, indicating a bullish crossover that suggests momentum is in favor of the bulls.

The histogram is positive, confirming bullish momentum. The bars are decreasing, indicating that momentum might be waning, but currently remains bullish.

No clear divergences are present between MACD and price action, aligning with the observed upward trend.

Volume Analysis

Volume increased significantly during the recent upward price movement, particularly on December 19, supporting the validity of the price rise.

The spike in volume suggests possible institutional interest or participation during the recent uptrend.

Current volume supports the price range, although monitoring any decrease is crucial for continued support.

Support & Resistance

Key support is around $56, previously tested as resistance, now serving as a support level after the upward movement.

The $58.50-$59 range serves as a resistance zone, where prices are currently testing. A breakout above this could signify continued upside.

Actionable Insights

Consider buying if there is a confirmed breakout above $59 with a volume increase, targeting higher resistance levels.

Holding positions can be considered if the price remains stable above the $56 support with healthy volume.

Watch for a reversal pattern or a bearish crossover in the MACD for selling signals.

The AI Technical Analysis Center is an informational tool only and does not constitute investment or trading advice.
This site is registered on wpml.org as a development site. Switch to a production site key to remove this banner.