Generic selectors
Exact matches only
Search in title
Search in content
Post Type Selectors

Popular stocks

Crypto

CFD

Currencies

Support

Gold

NSDQ – Technical Analysis – 4h

December 26, 2025 08:00

Quick Summary

The NASDAQ 100 Index chart reveals a notable upward trend, supported by strong technical indicators.

Key support and resistance levels are identified, providing actionable trading insights.

Candlestick Analysis

The chart shows a recent bullish trend with smaller pullbacks.

There is a bullish engulfing pattern that preceded the recent upward move, indicating strong buying interest.

The trend appears bullish, especially in the last few sessions where candlesticks are predominantly green.

MACD Analysis

The MACD line is above the Signal line, indicating bullish momentum.

The histogram is in positive territory and increasing, reinforcing the momentum.

There are no significant divergences; the MACD confirms price action with no major discrepancies.

Volume Analysis

There was a significant volume spike during the recent upward move, suggesting potential institutional buying.

The increased volume supports the price rally, which is a bullish sign.

The spike indicates strong interest and conviction behind the price movement.

Support & Resistance

Key support is around 25,250, where previous consolidation and buying interest was noted.

Immediate resistance is observed around 25,750.

A break above this could see a test of 26,000.

Actionable Insights

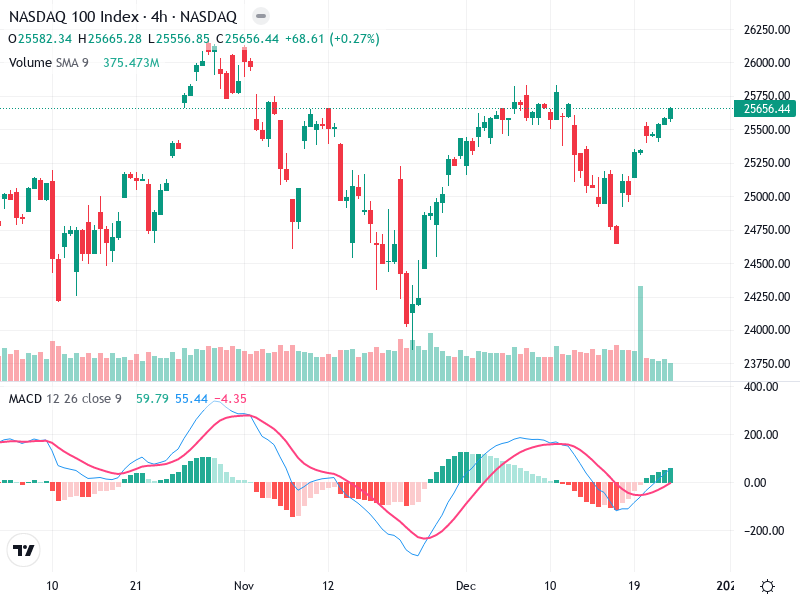
Consider buying if the price breaks and holds above the 25,750 resistance with strong volume.

Consider taking profits near 26,000, especially if there's a lack of volume support.

Hold positions if the price stays above 25,250, confirming the support level.

The AI Technical Analysis Center is an informational tool only and does not constitute investment or trading advice.
This site is registered on wpml.org as a development site. Switch to a production site key to remove this banner.