Generic selectors
Exact matches only
Search in title
Search in content
Post Type Selectors

Popular stocks

Crypto

CFD

Currencies

Support

Gold

AUD/USD – Technical Analysis – 4h

December 26, 2025 13:02

Quick Summary

The AUD/USD 4-Hour Chart shows a predominantly bullish trend with clear upward momentum. Significant price action has occurred near critical support and resistance levels. Traders should be cautious of potential pullbacks or breakouts.

Candlestick Analysis

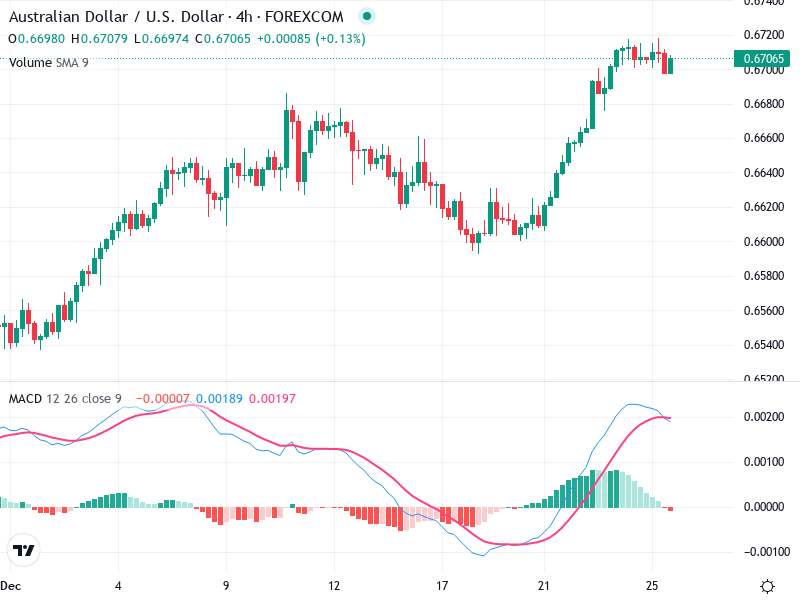
The chart exhibits a bullish trend with a noticeable upward trajectory, especially due to the sharp rise in recent sessions.

Larger green candlesticks during the recent rally indicate strong bullish momentum, despite potential topping near 0.6705 due to recent consolidation suggesting resistance.

A breakout from the 0.6640 region is observed, serving as short-term support, whereas resistance can be seen around 0.6720.

MACD Analysis

The MACD line has crossed above the Signal line, indicating bullish momentum, although the strength may be waning as the lines converge.

The MACD histogram reflects decreasing upward momentum, pointing to potential slowdown or consolidation phases.

No divergences are evident, as MACD movement aligns with price trends.

Volume Analysis

Volume increased during the recent price surge, reinforcing the bullish trend.

Rising volume supports the bullish move's credibility.

No significant volume spikes suggest a steady movement without drastic institutional activity.

Support & Resistance

Short-term support is found at 0.6640, where previous resistance has flipped to support.

Resistance is clearly marked at 0.6720, with failed attempts to surpass this level indicating a potential barrier.

Further gains may be inhibited by resistance challenges, suggesting cautious trading strategies at this level.

Actionable Insights

Consider buying on pullbacks to 0.6640 when a bullish reversal pattern is confirmed with volume support.

A sell or hold strategy may be advisable if the price struggles to break above 0.6720 and bearish candlestick patterns appear.

Watch for a clear breakout above 0.6720 with volume support to confirm further bullish momentum.

The AI Technical Analysis Center is an informational tool only and does not constitute investment or trading advice.
This site is registered on wpml.org as a development site. Switch to a production site key to remove this banner.