Generic selectors
Exact matches only
Search in title
Search in content
Post Type Selectors

Popular stocks

Crypto

CFD

Currencies

Support

Gold

GOLD – Technical Analysis – 4h

December 26, 2025 17:02

Quick Summary

The gold Futures chart currently exhibits a strong bullish trend. Recent movements have seen breakouts beyond previous highs, pointing towards continued upward momentum. The asset is exhibiting a favorable technical outlook overall.

Candlestick Analysis

The chart shows a bullish trend, with a series of higher highs and higher lows evident in the latter sections.

Multiple bullish candlesticks indicate strong upward momentum. The recent breakout above previous highs confirms ongoing bullish sentiment.

The recent move above the 4540 level is a key breakout, suggesting further upside potential.

MACD Analysis

The MACD line is above the signal line, indicating bullish momentum.

The histogram shows positive momentum but has recently started flattening, which could indicate a potential overextension.

No apparent divergences between MACD and price action, reinforcing the ongoing bullish trend.

Volume Analysis

Volume has generally supported price increases, with significant spikes correlating with bullish price movements.

The increased volume aligns with upward price moves, confirming buying interest.

A notable volume increase occurred at the most recent breakout, often a sign of institutional buying interest.

Support & Resistance

Key resistance is now around the 4580 level after the recent breakout.

Support levels were previously established around 4480, with minor consolidations visible.

A pullback to 4480, if it happens, could serve as a buying opportunity based on past behaviors.

Actionable Insights

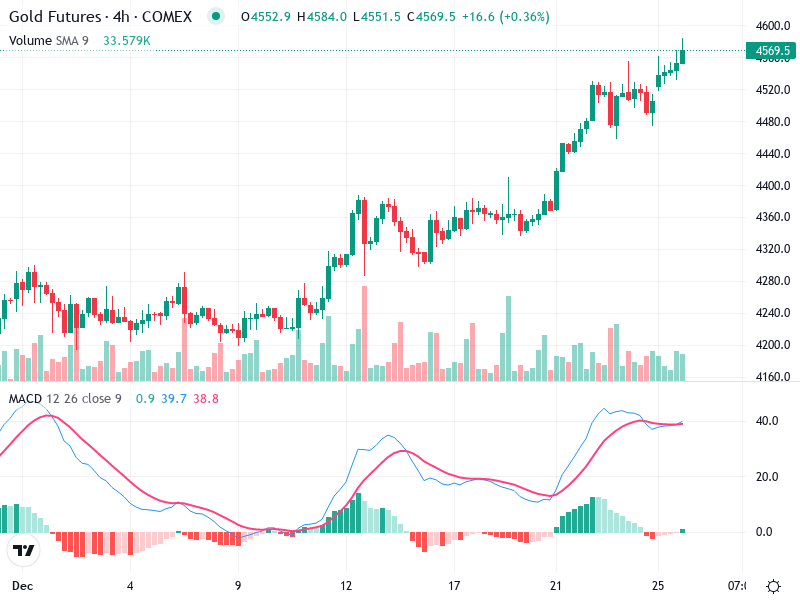
Consider buying on pullbacks to support levels around 4480, with a stop-loss slightly below.

Watch for potential exhaustion signals, such as bearish candlestick formations or negative MACD divergences, for sell signals.

Current holders should monitor momentum closely and consider tightening stops to lock in gains.

The AI Technical Analysis Center is an informational tool only and does not constitute investment or trading advice.
This site is registered on wpml.org as a development site. Switch to a production site key to remove this banner.