Generic selectors
Exact matches only
Search in title
Search in content
Post Type Selectors

Popular stocks

Crypto

CFD

Currencies

Support

Gold

GOLD – Technical Analysis – 4h

December 29, 2025 17:02

Quick Summary

The gold Futures chart shows recent significant activity with a shift in momentum. The asset has transitioned from a bullish to a bearish trend, as indicated by recent technical signals.

A major bearish candlestick pattern has emerged, suggesting a potential continuation of the downward trend. Traders should be vigilant for further developments.

Candlestick Analysis

There is a large bearish candlestick near the end of the chart, indicating strong selling pressure and possibly marking the start of a bearish trend.

The chart shows a recent bearish reversal after a strong upward trend. The sharp decline suggests increased bearish sentiment.

The recent drop below previous support levels indicates a potential breakout to the downside.

MACD Analysis

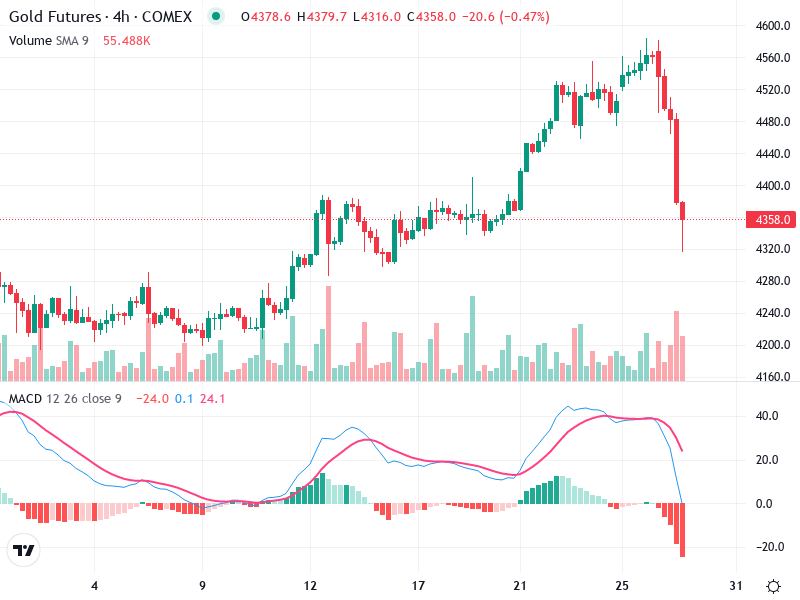
There has been a recent bearish crossover, with the MACD line crossing below the Signal line, further supporting the bearish momentum.

The histogram shows increasing negative momentum, reinforcing the downtrend.

There is no noticeable divergence between the MACD and price action; both are aligned in indicating a bearish trend.

Volume Analysis

The recent large bearish candlestick is accompanied by higher-than-average volume, suggesting strong conviction behind the move.

The increase in volume along with price decline supports the validity of the bearish move.

The spike in volume could indicate institutional selling or heightened market activity.

Support & Resistance

The previous key support around 4400 has been breached, now turning into a potential resistance level if prices attempt to recover.

The recent high around 4550 may act as a significant resistance zone.

Actionable Insights

Consider short positions or holding off on long positions until a clearer bullish signal emerges. Monitor for a potential retracement to test new resistance.

Watch for confirmation of bearish momentum with continued volume support or wait for a potential reversal pattern if considering long positions.

Quick reversals are possible if the move was driven by news or a transient factor. Ensure proper risk management.

The AI Technical Analysis Center is an informational tool only and does not constitute investment or trading advice.
This site is registered on wpml.org as a development site. Switch to a production site key to remove this banner.