Generic selectors
Exact matches only
Search in title
Search in content
Post Type Selectors

Popular stocks

Crypto

CFD

Currencies

Support

Gold

NZD/USD – Technical Analysis – 4h

December 30, 2025 13:00

Quick Summary

The NZD/USD 4-hour chart shows a generally bullish trend with recent indications of consolidation. Key levels at 0.57800 and 0.58200 are crucial for potential breakout and support zones.

Overall market sentiment appears cautious, possibly influenced by external factors or upcoming economic indicators.

Candlestick Analysis

A bullish engulfing pattern is present around the 17th, indicating a shift from bearish to bullish sentiment.

Recent candlesticks show indecision with small bodies, possibly indicating a pause in bullish momentum.

The overall trend has been bullish from mid-April, with recent pullbacks suggesting a possible consolidation phase.

MACD Analysis

A bearish crossover is currently observed, with the MACD line below the signal line, indicating potential bearish momentum.

The histogram is negative and increasing, suggesting a weakening bearish momentum and possibly signaling an upcoming bullish reversal.

No clear divergence is noted, but the increase in histogram bars suggests decreasing selling pressure.

Volume Analysis

Volume increased during the recent upward move, supporting the price rise.

Current volume is declining, aligning with the consolidating price movement, indicating reduced trading enthusiasm.

No significant unusual spikes suggesting institutional activity at this moment.

Support & Resistance

0.57800 is a key support level, a potential rebound point if the price drops further.

0.58200 and 0.58400 are key resistance levels to watch for a potential breakout.

The price shows potential consolidation within these levels.

Actionable Insights

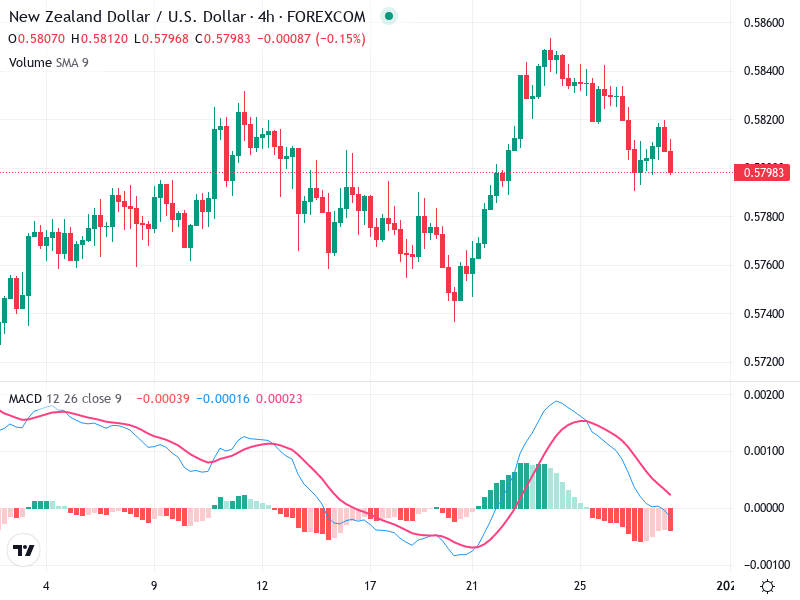
Consider buying on confirmation of bullish signals, especially if MACD shows a bullish crossover and price breaks above 0.58200 with volume support.

If price falls below 0.57800 with strong volume, it could signal further decline, indicating a potential shorting opportunity.

Caution is advised if price remains within the 0.57800 - 0.58200 range, awaiting clearer directional cues.

The AI Technical Analysis Center is an informational tool only and does not constitute investment or trading advice.
This site is registered on wpml.org as a development site. Switch to a production site key to remove this banner.