Generic selectors
Exact matches only
Search in title
Search in content
Post Type Selectors

Popular stocks

Crypto

CFD

Currencies

Support

Gold

OIL – Technical Analysis – 4h

December 30, 2025 17:00

Quick Summary

The asset chart displays a notable recovery from an earlier downtrend.

This transition is highlighted by emerging higher highs and higher lows, indicating a bullish phase.

A significant increase in trading volume supports the upward movement.

Candlestick Analysis

The chart exhibits a recovery from a downtrend, transitioning into a more bullish phase with higher highs and higher lows.

A bullish engulfing pattern is identified around the mid-point of the chart, indicating a potential reversal from the previous downtrend.

The price recently broke out of a consolidation zone near $57, indicating increasing bullish momentum.

MACD Analysis

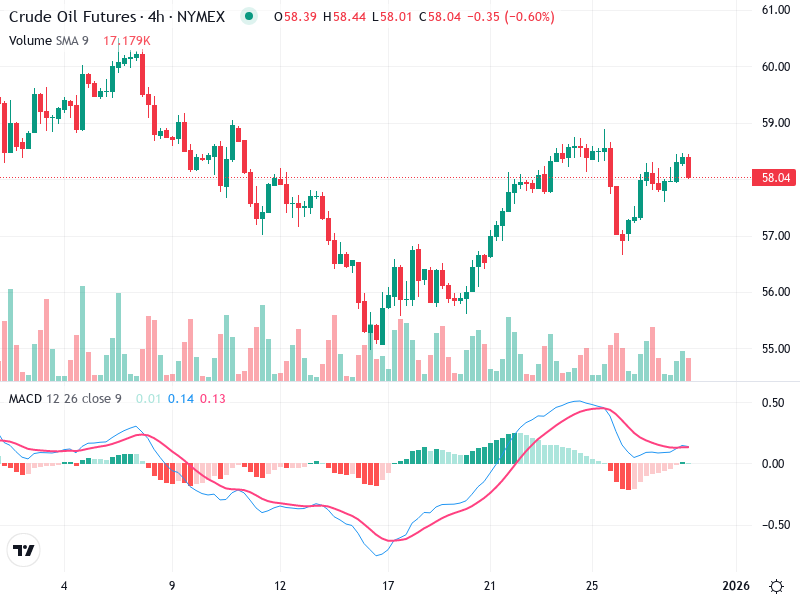
The MACD line is above the Signal line, showing a bullish crossover that suggests upward momentum.

The positive MACD histogram is tapering slightly, suggesting waning momentum, which could be a warning of potential consolidation or reversal.

No clear divergences are noted at this point, suggesting that the price is relatively in line with momentum indicators.

Volume Analysis

The volume has increased significantly around the breakout above $57, confirming the legitimacy of the move.

Several high volume bars are present, indicating potential institutional interest or significant trader activity.

The volume trends support the identified breakout and subsequent bullish sentiment.

Support & Resistance

Support is established around $57, which was the previous resistance zone and now could act as a support if the price pulls back.

Resistance is found around $59, where the price has struggled to break through recently.

This setup provides clear levels for positioning strategies based on price action.

Actionable Insights

Consider buying if the price remains above the $57 support line with confirming volume.

Look to take profits or short if the price fails to break above the $59 resistance with declining MACD momentum.

If already in a position, watch for a break above $59 or a firm hold above $57 to continue holding.

The AI Technical Analysis Center is an informational tool only and does not constitute investment or trading advice.
This site is registered on wpml.org as a development site. Switch to a production site key to remove this banner.