Generic selectors
Exact matches only
Search in title
Search in content
Post Type Selectors

Popular stocks

Crypto

CFD

Currencies

Support

Gold

NSDQ – Technical Analysis – 4h

December 31, 2025 08:00

Quick Summary

The asset is showcasing a significant technical pattern with noteworthy movements.

Recent trends suggest a change in market dynamics, highlighting potential opportunities.

Keep an eye on breakout and support zones for strategic decisions.

Candlestick Analysis

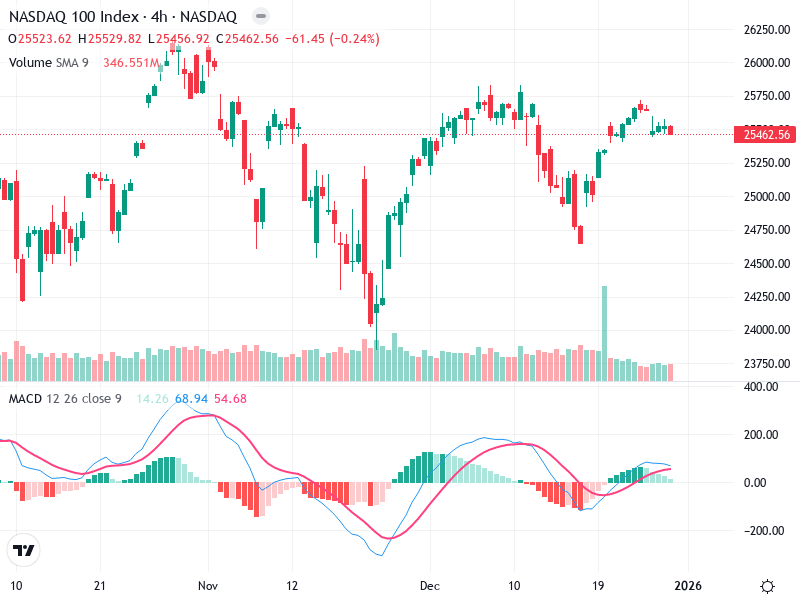
The chart indicates a recovery from a recent downtrend to an upward consolidation, now showing a sideways trend. Initially, there was a bearish sentiment that shifted to bullish.

There appears to be a bullish engulfing pattern earlier in the upward move, indicating a reversal from bearish to bullish.

A doji pattern near the recent top suggests indecision, highlighting potential change or continuation depending on confirmation from subsequent candles.

MACD Analysis

There is a recent bullish crossover where the MACD line crosses above the Signal line, signaling potential upward momentum.

The histogram shows declining positive momentum, suggesting potential for a consolidation phase or a minor pullback.

No significant divergence is observed between MACD and price, indicating that current price movements are aligned with MACD readings.

Volume Analysis

A noticeable spike in volume is present during the last upward thrust. High volume on up moves indicates strong buying interest which is a supportive factor.

Recent low volume levels during consolidation suggest a lack of strong selling pressure, reinforcing the current sideways trend.

The overall volume pattern supports the bullish outlook, given the increased interest during upward movements.

Support & Resistance

Around 25,250 this level acted as a strong support during previous pullbacks.

Around 25,750 this has shown resistance where the price last stalled.

These levels are crucial for determining future trading strategies based on potential breakouts or pullbacks.

Actionable Insights

Consider buying on a confirmed breakout above 25,750 with increased volume.

Potential short if the price decisively breaks below the 25,250 support with strong volume.

Maintain a hold between these levels, awaiting a breakout or breakdown for further action.

The AI Technical Analysis Center is an informational tool only and does not constitute investment or trading advice.
This site is registered on wpml.org as a development site. Switch to a production site key to remove this banner.