Generic selectors
Exact matches only
Search in title
Search in content
Post Type Selectors

Popular stocks

Crypto

CFD

Currencies

Support

Gold

EUR/USD – Technical Analysis – 4h

December 31, 2025 08:02

Quick Summary

The EUR/USD 4-hour chart indicates a predominantly bearish sentiment, marked by a slight downward trajectory post-resistance encounter at 1.1800. The technical indicators suggest a cautious approach while monitoring for trend reversal signals at support levels around 1.1720.

Candlestick Analysis

The presence of small-bodied candles near the current price suggests consolidation and potential indecision in the market.

Recent candlesticks show a slight bearish trend, as indicated by consecutive red candles.

The trend appears to be slightly bearish in the short term as the price is declining after reaching resistance around 1.1800.

MACD Analysis

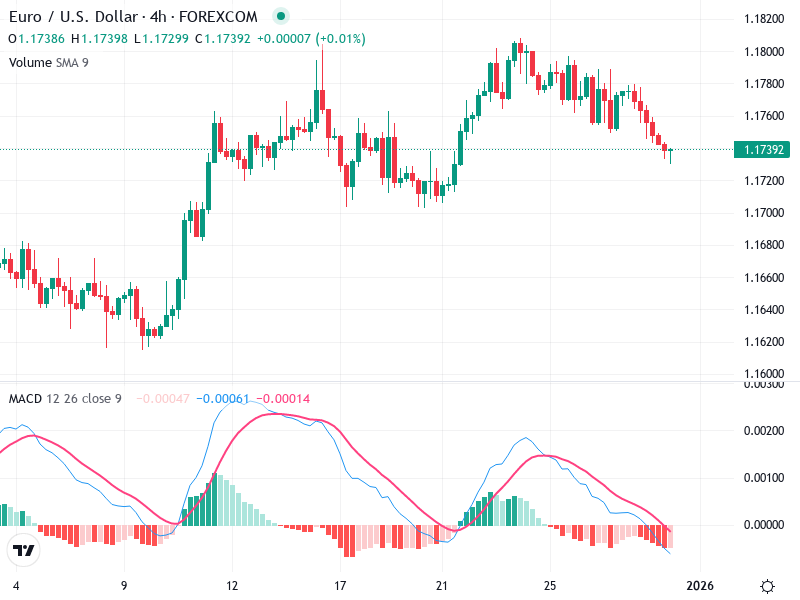
The MACD line is below the Signal line, indicating a bearish crossover. This suggests downward momentum.

The histogram is negative and expanding, which confirms increasing bearish momentum.

No clear divergence is observed between the MACD and price action, aligning them with the current downtrend.

Volume Analysis

Volume appears to be consistent with the current price action, with no significant volume spikes suggesting strong institutional activity.

The lack of volume spikes suggests that recent price movements are more retail-driven, without significant institutional push.

No unusual volume activity is detected that would imply an imminent trend change.

Support & Resistance

Key resistance is near the 1.1800 mark, where previous selling pressure was observed.

Support is around 1.1720, which has provided support in the past. A break below could signify further downside.

Maintain vigilance around these key levels for potential price reactions.

Actionable Insights

Consider selling if the price breaks below the 1.1720 support with increased volume.

If holding short positions, maintain them while watching for any reversal signals.

Watch for a bullish reversal pattern near support for potential buying opportunities.

The AI Technical Analysis Center is an informational tool only and does not constitute investment or trading advice.
This site is registered on wpml.org as a development site. Switch to a production site key to remove this banner.