Generic selectors
Exact matches only
Search in title
Search in content
Post Type Selectors

Popular stocks

Crypto

CFD

Currencies

Support

Gold

NZD/USD – Technical Analysis – 4h

December 31, 2025 13:00

Quick Summary

The chart is indicating a bearish trend with potential reversals around key levels. has experienced a downward movement recently, and careful observation of support levels is recommended.

Indicators suggest a prevailing bearish sentiment, but reversal signals could alter the current direction.

Candlestick Analysis

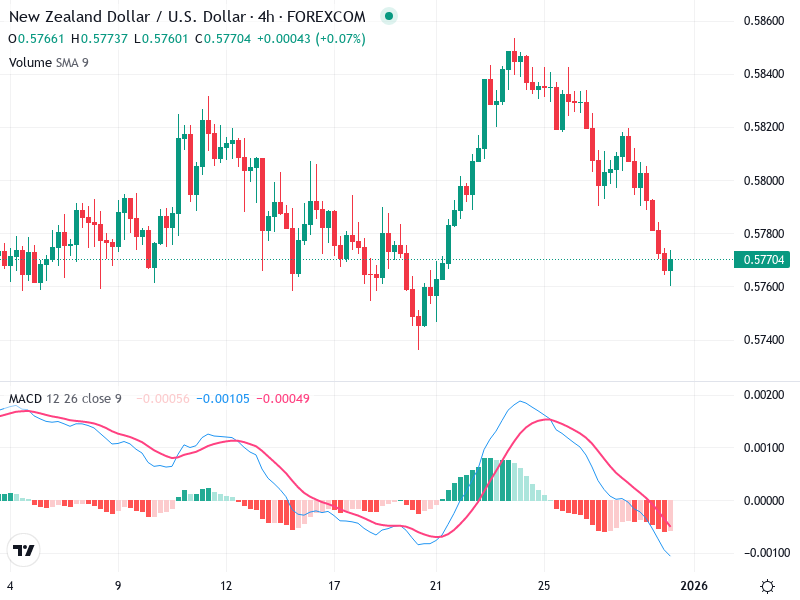
The chart shows a recent bearish trend following a peak around mid-chart. Initially, there was a bullish push, but a reversal initiated a downward move.

A potential hammer pattern appears as the last candlestick, suggesting a possible reversal. No clear bullish engulfing or strong reversal patterns are visible yet.

Around 0.58200 was a breakout zone, followed by a significant pullback indicating resistance.

MACD Analysis

The MACD line is below the Signal line, indicating a bearish crossover—suggesting continued downward momentum.

It shows negative bars growing larger, enhancing the bearish sentiment. Momentum is strongly in favor of the downside.

No clear divergences between MACD and price action currently indicate a continuation of the bearish trend.

Volume Analysis

A slight increase in volume during the downward movement supports the price direction.

No significant spikes indicating unusual activity, which means the moves might not be driven by institutional investors.

The observed volume trends reinforce the current bearish momentum.

Support & Resistance

Support is around 0.57600, which is presently being tested. A break below this could lead to further declines.

Resistance is near 0.58200, which capped the recent bullish moves and should be watched for changes in sentiment.

Monitoring these levels will be crucial in anticipating further price movement.

Actionable Insights

Consider watching for any confirmation of a reversal pattern before entering positions. Buyers should be cautious and look for signals like a confirmed hammer or bullish divergence on MACD.

Look for additional confirmation if price holds above 0.57600 or drops below to indicate further downside.

A move beyond 0.58200 with high volume may indicate a reversal, negating the current bearish sentiment.

The AI Technical Analysis Center is an informational tool only and does not constitute investment or trading advice.
This site is registered on wpml.org as a development site. Switch to a production site key to remove this banner.