Generic selectors
Exact matches only
Search in title
Search in content
Post Type Selectors

Popular stocks

Crypto

CFD

Currencies

Support

Gold

EUR/USD – Technical Analysis – 4h

January 1, 2026 08:02

Quick Summary

The EUR/USD 4-hour chart shows potential for market movement. Recently, the pair has been trading within a range, reflecting the market’s uncertainty. The technical indicators present mixed signals, suggesting traders should stay vigilant for potential shifts in momentum.

Candlestick Analysis

A potential hammer candlestick is forming, indicating a possible reversal from the bearish trend.

The trend appears to be sideways to slightly bearish after the peak around 1.1800, with lower highs suggesting selling pressure.

The area around 1.1720 appears to be crucial support, while 1.1800 remains significant resistance.

MACD Analysis

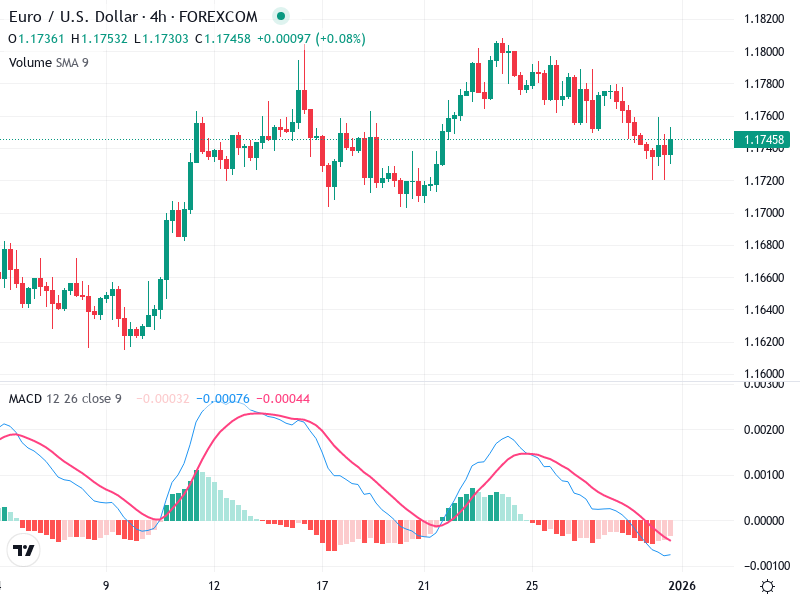
Recently, the MACD line is below the signal line, indicating bearish momentum, although they appear to be converging, suggesting a possible forthcoming crossover.

The MACD histogram is showing bearish activity with negative bars, but these are decreasing in size, indicating potential weakening of bearish momentum.

No clear divergences have been observed recently between MACD and price action.

Volume Analysis

Volume has slight fluctuations, with minor increases during the formation of bearish candles, supporting recent downward movements.

The overall decrease in volume suggests a lack of strong conviction from sellers, which might precede a reversal if bulls pick up the pace.

No significant spikes indicative of institutional activity have been observed.

Support & Resistance

1.1720 is acting as a crucial support zone. Breaking this level decisively could lead to further declines.

1.1800 is crucial resistance. A successful breach above this level could indicate bullish momentum resuming.

Traders should monitor these support and resistance levels closely for potential entries or exits.

Actionable Insights

Consider entering a long position if there is a clear bullish signal or bullish crossover on the MACD, especially if it coincides with a break above 1.1760.

If the price breaks below 1.1720 with significant volume, consider short positions targeting lower support levels.

Traders may wait for clearer signals, such as a MACD crossover or sustained breakouts, for better decision-making.

The AI Technical Analysis Center is an informational tool only and does not constitute investment or trading advice.
This site is registered on wpml.org as a development site. Switch to a production site key to remove this banner.