Generic selectors
Exact matches only
Search in title
Search in content
Post Type Selectors

Popular stocks

Crypto

CFD

Currencies

Support

Gold

GOLD – Technical Analysis – 4h

January 1, 2026 17:02

Quick Summary

The 4-hour chart of gold Futures shows a shift in market dynamics with recent bearish trends dominating.

The asset is navigating key support and resistance levels which are crucial for its potential direction.

Monitoring MACD and volume trends offers insights for traders.

Candlestick Analysis

Recent candlestick formations indicate bearish sentiment with long red candles showing strong selling pressure.

An attempt at a bottoming tail (hammer-like formation) is visible, suggesting a possible weak attempt at reversal.

The trend has shifted from a bullish run-up to a bearish phase after a strong sell-off from the recent high.

MACD Analysis

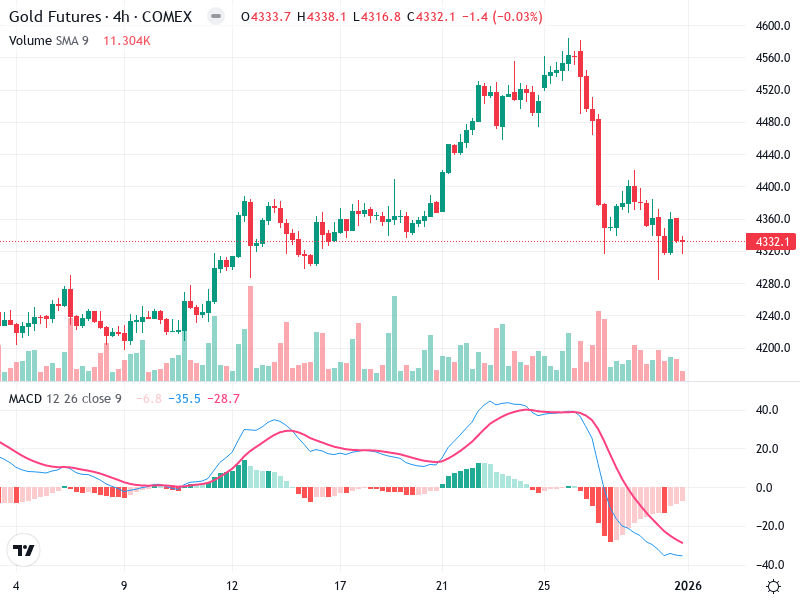
The MACD line is below the Signal line, indicating a sustained bearish momentum.

There is a significant gap between the two lines, confirming the bearish crossover.

No divergence is currently noted between MACD and price action, as both are aligned in a downward trend.

Volume Analysis

There was a notable spike in volume during the sharp sell-off, confirming the bearish move.

Increased volume on down days supports the strength of the bearish trend.

Institutional activity might have triggered the selling pressure, as indicated by the volume spikes.

Support & Resistance

The price is approaching a potential support level around 4280, highlighted by previous consolidation.

Resistance is established around 4460, where the previous support turned into resistance.

These levels are crucial for potential reversals or further breakdowns.

Actionable Insights

Consider a cautious approach with a potential buy at confirmed support around 4280 if reversal signals are evident.

A sell or short position may be considered if the price fails to hold above the support and breaks below 4280 with volume confirmation.

Watch for confirmation of reversal patterns or further breakdown signals, and keep an eye on volume changes for additional clues on market sentiment.

The AI Technical Analysis Center is an informational tool only and does not constitute investment or trading advice.
This site is registered on wpml.org as a development site. Switch to a production site key to remove this banner.