Generic selectors
Exact matches only
Search in title
Search in content
Post Type Selectors

Popular stocks

Crypto

CFD

Currencies

Support

Gold

EUR/USD – Technical Analysis – 4h

January 2, 2026 08:02

Quick Summary

The recent chart analysis of indicates a potential shift in market dynamics.

The asset is currently testing key support and resistance levels, which may determine its near-term direction.

Candlestick Analysis

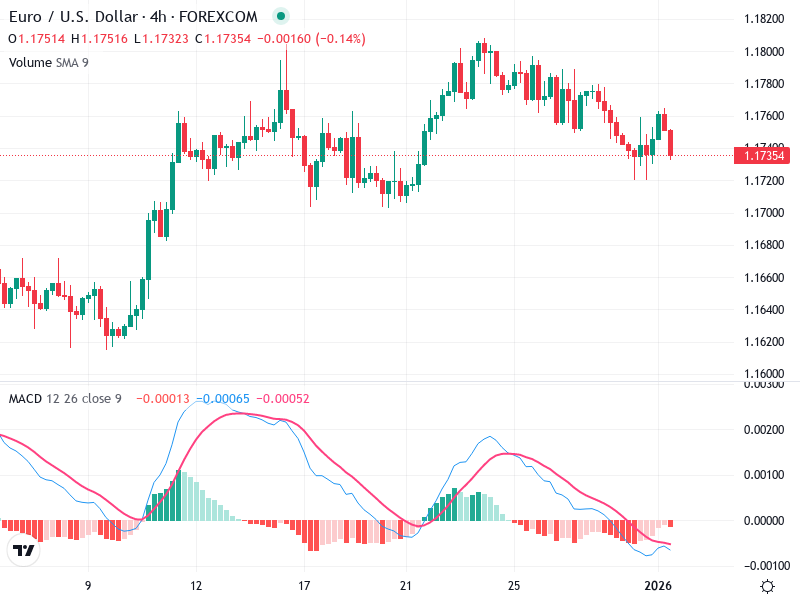
There was a recent bearish candlestick, indicating selling pressure.

Previously, there was a period of consolidation with indecisive candles, suggesting a possible pause in trend.

The trend appears to be slightly bearish in the short term, following a previous upward movement.

MACD Analysis

The MACD line is below the Signal line, indicating a bearish crossover which suggests downward momentum.

The histogram shows increasing negative bars, reinforcing the bearish momentum.

No clear divergence is present, as price action and MACD seem to agree on the current trend direction.

Volume Analysis

Volume appears to be consistent, with no significant spikes or drops.

The recent small decrease with consistent volume suggests a less aggressive selling force.

No noticeable volume spikes, indicating lack of institutional activity at the moment.

Support & Resistance

Strong support is anticipated around 1.1720, based on recent price actions.

Near-term resistance is seen at 1.1760, which was previously tested.

Actionable Insights

Given the bearish indicators, a cautious approach is recommended.

If price breaks below 1.1720 with volume confirmation, a short position might be considered.

Monitor for any bullish candlestick formations or volume increase to suggest a reversal potential.

The AI Technical Analysis Center is an informational tool only and does not constitute investment or trading advice.
This site is registered on wpml.org as a development site. Switch to a production site key to remove this banner.