Generic selectors
Exact matches only
Search in title
Search in content
Post Type Selectors

Popular stocks

Crypto

CFD

Currencies

Support

Gold

AUD/USD – Technical Analysis – 4h

January 2, 2026 13:02

Quick Summary

The AUD/USD 4-hour chart reveals an interesting technical setup. The pair has been showing some bullish momentum, although there is currently indecision in the market. Key price levels are being tested, indicating a potential shift in trend direction.

Candlestick Analysis

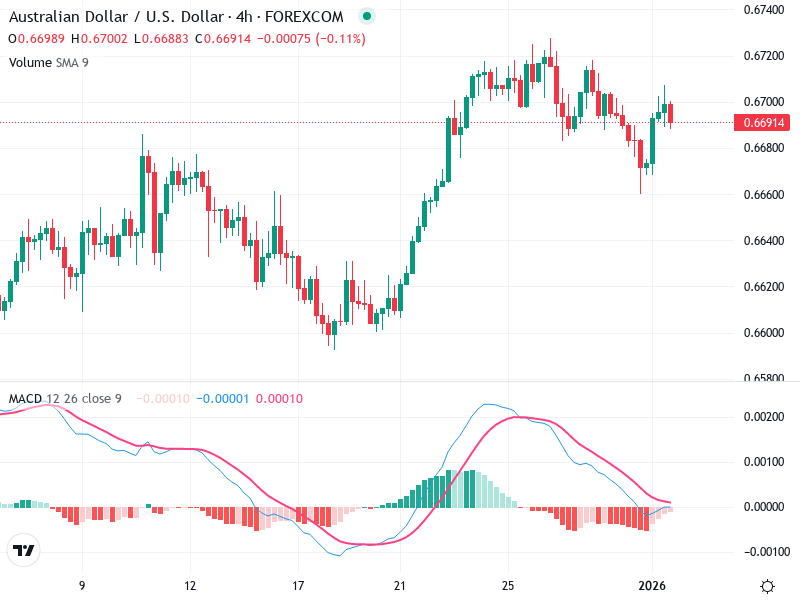
The recent candlestick patterns show a series of small-bodied candles, indicating indecision in the market.

Previously, a bullish engulfing pattern can be seen, followed by a sharp upward trend.

The trend transitioned from bearish to bullish, evident from the recovery after the bottom at approximately 0.6580. Currently, the trend appears to be sideways with slight bullish bias after a pullback.

MACD Analysis

The MACD line is above the signal line, indicating a recent bullish crossover, but they are converging, suggesting weakening bullish momentum.

The histogram is decreasing, illustrating reduced bullish momentum.

There are no significant divergences observed between MACD and price action at the moment.

Volume Analysis

Volume appears to be stable with no major spikes, indicating general participation without heavy institutional entry.

Volume supporting the recent uptrend was moderate, consistent with a lack of explosive bullish conviction.

No significant volume spikes were noted at present, which suggests caution for strong breakouts or breakdowns.

Support & Resistance

Primary support is found around 0.6660, which coincides with previous consolidation.

Immediate resistance is at 0.6720, which has been tested but not decisively broken.

These levels are crucial as a breakout above resistance may lead to a continuation of the uptrend, whereas a breakdown could bring the price back toward support.

Actionable Insights

Consider a cautious hold or buy strategy if the price breaks and sustains above 0.6720 with strong volume.

Alternatively, look for short opportunities if it breaks below 0.6660 with confirming volume and MACD signals.

Watch for a potential MACD crossover and significant volume changes as confirmation signals for direction.

The AI Technical Analysis Center is an informational tool only and does not constitute investment or trading advice.
This site is registered on wpml.org as a development site. Switch to a production site key to remove this banner.