Generic selectors
Exact matches only
Search in title
Search in content
Post Type Selectors

Popular stocks

Crypto

CFD

Currencies

Support

Gold

OIL – Technical Analysis – 4h

January 2, 2026 17:01

Quick Summary

The Crude Oil Futures chart currently exhibits a mixed sentiment. The asset has been experiencing sideways movement with a slight bearish bias. Key technical indicators suggest careful monitoring of the $56 and $58 levels for potential trades.

Candlestick Analysis

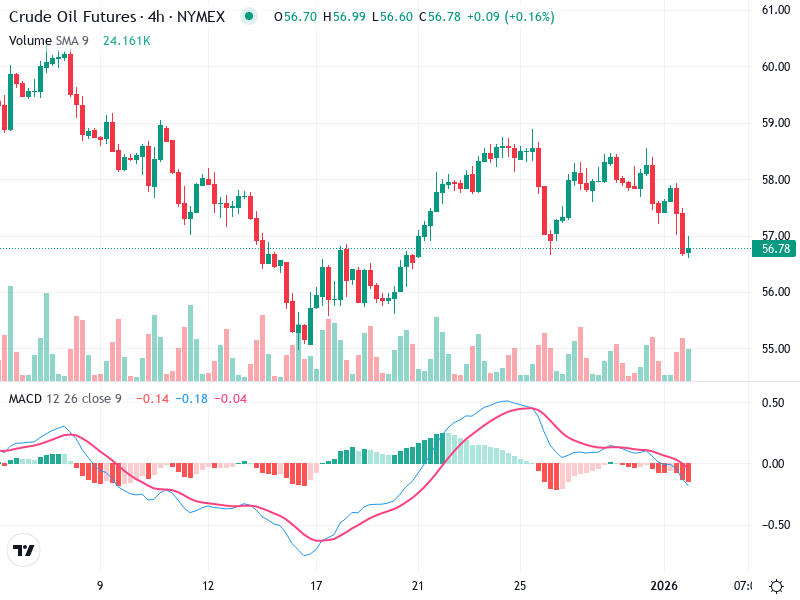
The recent sessions lack clear reversal patterns, such as a bullish engulfing or hammer formation. Instead, the chart reflects a downtrend followed by a minor recovery.

The overall trend is sideways to bearish, with recent candlesticks showing indecision but leaning towards a bearish bias.

There is a significant level around $57, where price action may attempt a breakout or confront resistance.

MACD Analysis

The MACD line is situated below the Signal line, indicating a recent bearish crossover.

The MACD histogram displays increasing bearish momentum, marked by downward-extending bars, which suggests continuity in the trend unless a reversal emerges.

There are no notable divergences between price action and MACD, which aligns with the noted trend.

Volume Analysis

No significant volume spikes have been observed in recent sessions, suggesting a lack of strong institutional activity.

During the recent price drop, the relatively medium trading volume signifies moderate selling pressure.

The absence of unusual volume spikes is consistent with the prevailing bearish-to-neutral sentiment.

Support & Resistance

Immediate support is expected around the $56 level, highlighted by previous lows.

Resistance is anticipated near the $58 mark, indicated by earlier peaks that failed to break higher.

Crossing either of these levels could lead to accelerated price movement in the respective direction.

Actionable Insights

Consider selling or shorting if the price breaches the $56 support level, ensuring increased volume to confirm the move.

Alternatively, entering long positions might be viable if the price rebounds and holds above $58, contingent upon supportive volume.

Stay vigilant for confirmation signals near important support and resistance levels to mitigate the risk of false breakouts. Continuously assess MACD and volume trends for any changes indicating momentum shifts.

The AI Technical Analysis Center is an informational tool only and does not constitute investment or trading advice.
This site is registered on wpml.org as a development site.