Generic selectors
Exact matches only
Search in title
Search in content
Post Type Selectors

Popular stocks

Crypto

CFD

Currencies

Support

Gold

NZD/USD – Technical Analysis – 4h

January 5, 2026 13:00

Quick Summary

The chart of shows it is currently in a consolidation phase near the 0.57561 levels. Significant levels are being approached, which could be key for determining the next direction. The technical indicators suggest mixed signals, balancing between a potential reversal and continuation of the current trend.

Candlestick Analysis

The chart shows a recent downtrend after peaking near 0.58400, with a sideways movement indicating consolidation.

Several small-bodied candles are present, indicating indecision and suggesting potential for a reversal or continuation soon.

The 0.57400 level acts as a support zone, with a potential breakout above 0.57800 indicating a bullish reversal.

MACD Analysis

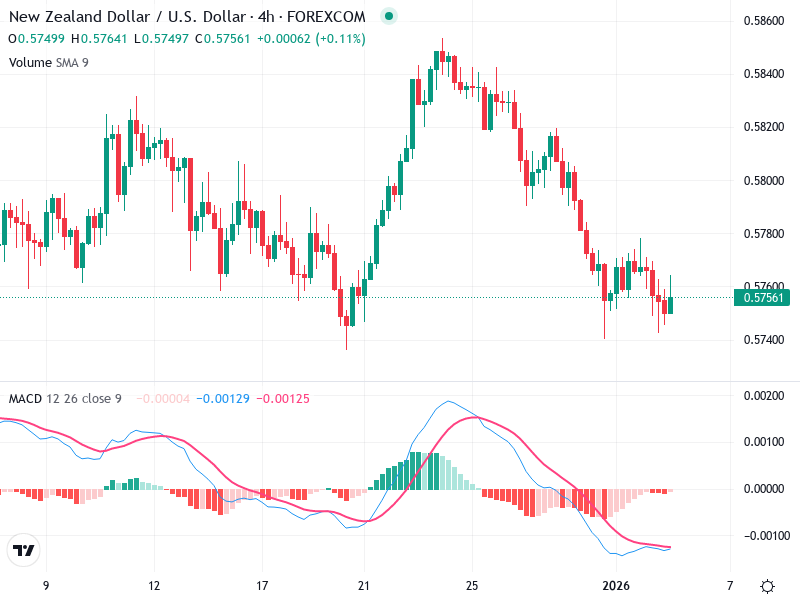
The MACD line is below the Signal line, indicating bearish momentum; however, they are converging, suggesting a potential bullish crossover.

The MACD histogram reveals declining bearish momentum, possibly leading to a bullish shift if the trend continues.

At this period, there is no significant divergence between MACD and price action.

Volume Analysis

The volume is relatively stable with no remarkable spikes, aligning with the recent sideways movement and suggesting a lack of strong buying or selling pressure.

Steady volume suggests any breakout with increased volume could indicate a stronger move.

Volume trends currently do not signal immediate strong actions but point to possible future volatility.

Support & Resistance

The chart shows support around 0.57400, which has been tested multiple times recently.

Resistance is observed near the 0.57800 mark, which is a key level for bullish breakthroughs.

Strong volume breaching these levels could indicate the next directional move.

Actionable Insights

Consider buying if there's a confirmed bullish crossover in the MACD paired with a breakout above the 0.57800 resistance backed by increased volume.

Selling could be prudent if the price falls below the 0.57400 support with concurrent MACD bearish confirmation.

A cautious hold is recommended until clearer signals or patterns emerge, especially if significant volume changes are absent.

The AI Technical Analysis Center is an informational tool only and does not constitute investment or trading advice.
This site is registered on wpml.org as a development site. Switch to a production site key to remove this banner.