Generic selectors
Exact matches only
Search in title
Search in content
Post Type Selectors

Popular stocks

Crypto

CFD

Currencies

Support

Gold

AUD/USD – Technical Analysis – 4h

January 5, 2026 13:02

Quick Summary

The chart reflects a consolidation phase after an initial uptrend, indicating a period of indecision in the market. The asset is hovering between key support and resistance levels. A breakout from this range could signal the next significant move for the asset.

Candlestick Analysis

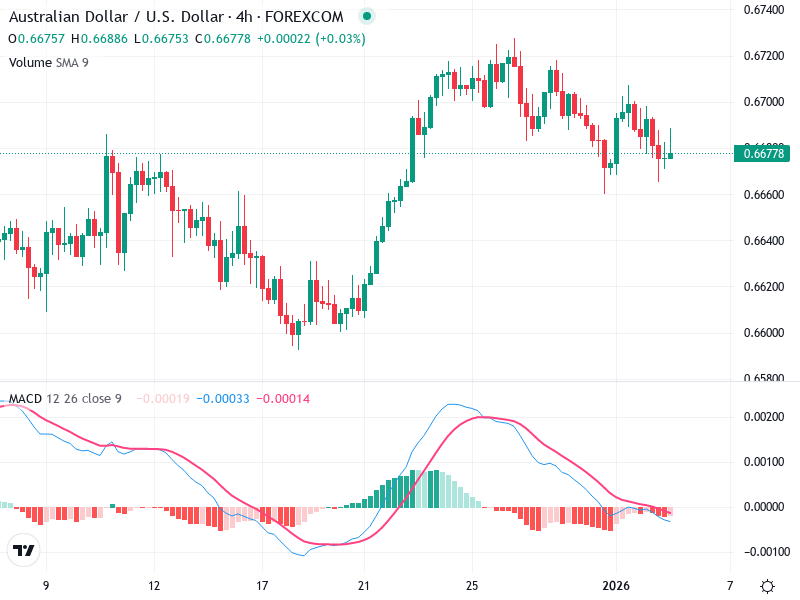
There are no strong reversal patterns such as bullish engulfing or doji at the recent price action, but there's been a series of small-bodied candles, indicating indecision.

The chart initially shows an uptrend, followed by a sideways movement, suggesting a consolidation phase after the upward move.

The recent peak around 0.67200 could serve as a resistance level, with the previous trough near 0.66200 acting as support.

MACD Analysis

The MACD line has crossed just above the Signal line, but it's relatively flat, suggesting weak bullish momentum.

The histogram has been oscillating near the zero line, indicating a lack of strong momentum in either direction.

There are no clear divergences between MACD and price, suggesting current price levels are in line with momentum.

Volume Analysis

The chart shows relatively stable volumes without dramatic spikes, indicating a lack of strong institutional activity.

The gradual increase in price wasn't accompanied by significant volume increases, which may weaken the bullish case.

No unusual spikes are evident, supporting the notion of a consolidation phase.

Support & Resistance

Key support is outlined around 0.66200.

Resistance is visible around 0.67200.

These levels are critical for potential reversals or confirming breakouts.

Actionable Insights

Consider buying if the price closes above 0.67200 with increased volume, supporting a breakout.

A break below 0.66200 could indicate downside continuation, suitable for selling.

Sideways movement suggests holding until a clear trend emerges.

The AI Technical Analysis Center is an informational tool only and does not constitute investment or trading advice.
This site is registered on wpml.org as a development site. Switch to a production site key to remove this banner.