Generic selectors
Exact matches only
Search in title
Search in content
Post Type Selectors

Popular stocks

Crypto

CFD

Currencies

Support

Gold

GBP/USD – Technical Analysis – 4h

January 5, 2026 13:04

Quick Summary

The chart analysis for the asset highlights recent market conditions. The asset has demonstrated potential reversal signals amid a bullish trend, entering a sideways consolidation phase with noticeable support and resistance levels.

Key indicators are suggesting possible upcoming bullish movements, especially with MACD trends and notable volume spikes.

Candlestick Analysis

The chart shows several candlestick formations.

Recent candlesticks indicate potential reversal signals with small-bodied candles, potentially forming a doji pattern, suggesting indecision in the market.

The market appears to have been in a bullish trend, which has recently entered a sideways consolidation phase with frequent reversals.

MACD Analysis

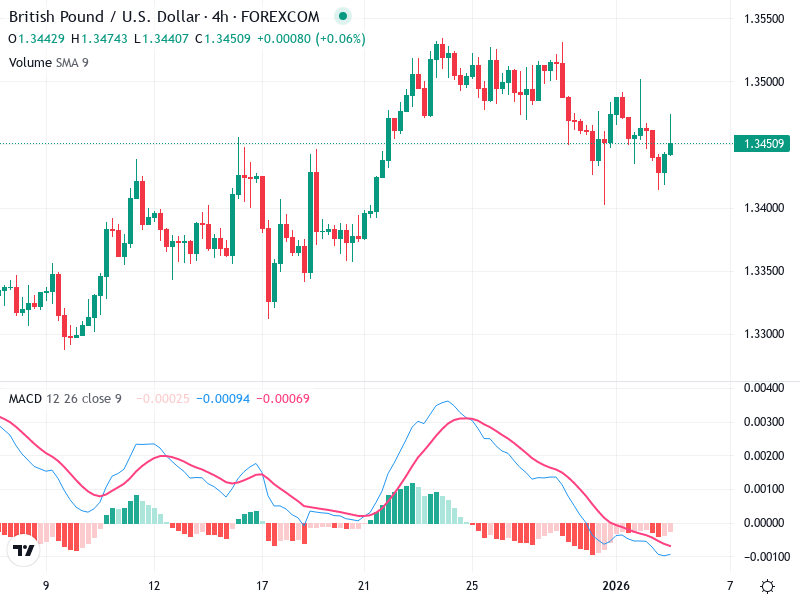
The MACD line (blue) is below the Signal line (red), indicating bearish momentum for now.

The histogram shows decreasing bearish momentum, suggesting a possible upcoming bullish crossover if the trend reverses.

No significant divergences present currently between price and MACD, though any upcoming bullish crossover would warrant attention for potential trend reversal.

Volume Analysis

Trading volume appears stable; however, there were recent spikes aligning with price reversals, suggesting selling pressure or profit-taking at highs.

Recent volume does not strongly support any new uptrend.

Increased volume during rallies would support a stronger bullish sentiment.

Support & Resistance

1.3400 is a key support level.

Any sustained break below could lead to further downside.

1.3500 is a critical resistance zone. A close above this level could indicate a new bullish run.

Actionable Insights

Consider buying upon a confirmed close above the 1.3500 resistance with increased volume to signal a stronger upside.

Selling or shorting if the price breaks below 1.3400 with significant volume increase might be prudent.

Maintaining positions within the current range unless either level breaks decisively.

The AI Technical Analysis Center is an informational tool only and does not constitute investment or trading advice.
This site is registered on wpml.org as a development site. Switch to a production site key to remove this banner.