Generic selectors
Exact matches only
Search in title
Search in content
Post Type Selectors

Popular stocks

Crypto

CFD

Currencies

Support

Gold

OIL – Technical Analysis – 4h

January 5, 2026 17:00

Quick Summary

The chart indicates a recent shift in trend following a period of downturn, with buyers gaining control. Several key technical patterns suggest a potential further move.

The asset shows strong price movements backed by significant volume.

Candlestick Analysis

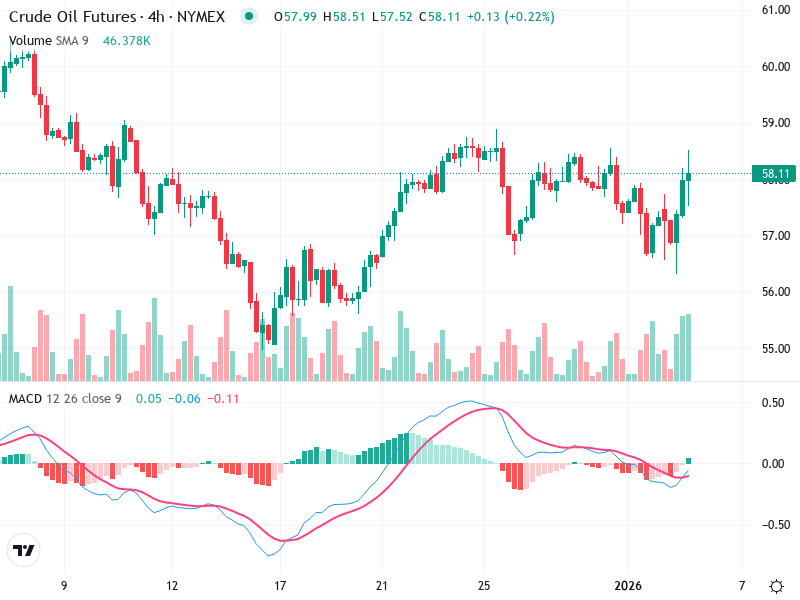
The chart shows a recent bullish trend reversal following a prior downtrend. The presence of several green candlesticks indicates buyers are gaining control.

A notable candlestick pattern is observed with a bullish engulfing pattern near the low, potentially signaling a reversal from the previous bearish movement.

The price has recently broken above the $58 level, which might have been a minor resistance in the past.

MACD Analysis

The MACD line has crossed above the Signal line, indicating a bullish crossover. This suggests positive momentum and a potential increase in buying pressure.

The histogram has turned positive, further supporting upward momentum.

No clear divergence observed, aligning MACD direction with the price action.

Volume Analysis

An increase in volume is observed during the breakout above $58, indicating strong buying interest.

The volume supports the recent price increase, confirming bullish interest in the breakout.

Noticeable volume spikes align with upward price movements, suggesting possible institutional buying.

Support & Resistance

Key support exists around $56, where a previous consolidation took place.

Immediate resistance is noticed around $59.

A break and close above could validate further bullish potential.

Actionable Insights

Consider buying opportunities if the price sustains above $58 with supported volume and MACD staying positive.

Monitor the resistance levels around $59 for potential breakouts or reversals. Look for confirmation such as continued volume strength and MACD bullish position.

Be cautious of potential pullbacks if the price falls back below recent supports with decreasing volume.

The AI Technical Analysis Center is an informational tool only and does not constitute investment or trading advice.
This site is registered on wpml.org as a development site. Switch to a production site key to remove this banner.