Generic selectors
Exact matches only
Search in title
Search in content
Post Type Selectors

Popular stocks

Crypto

CFD

Currencies

Support

Gold

NSDQ – Technical Analysis – 4h

January 7, 2026 08:01

Quick Summary

The chart for the asset displays a noticeable upward movement, driven by recent bullish momentum. Evidence of buying pressure is apparent, as seen in the technical indicators.

Watching the asset closely in approaching resistance levels will be critical to understanding the strength of the trend.

Candlestick Analysis

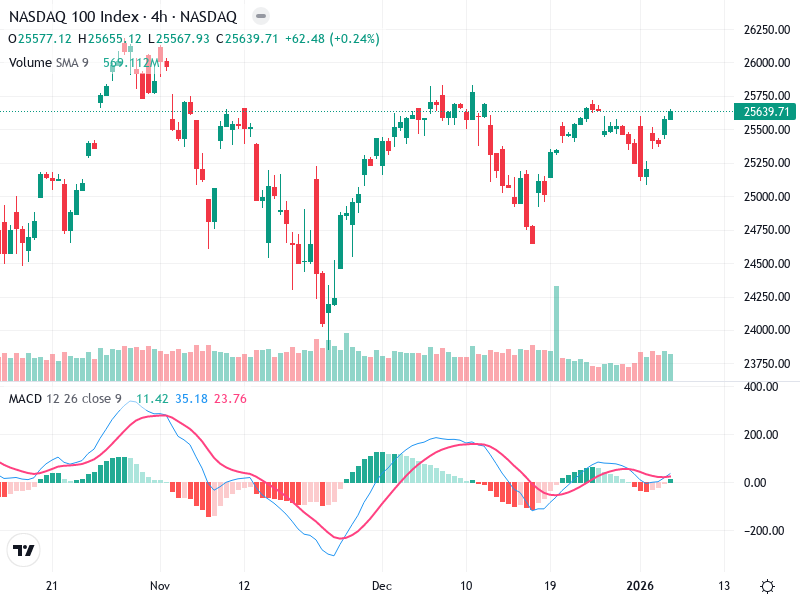
The recent candlesticks show a series of green candles, indicating bullish momentum. Prior to this, there was a notable bullish engulfing pattern which may have signaled the current uptrend.

The trend appears to be shifting towards bullish after a period of sideways and downward movement.

Price is approaching the resistance zone around 25,750, which may be a breakout level if the momentum continues.

MACD Analysis

The MACD line has crossed above the Signal line, indicating a bullish crossover. This suggests increasing buying momentum.

The histogram shows positive values that are expanding, indicating strengthening bullish momentum.

There are no clear divergences observed between the MACD and the price action currently.

Volume Analysis

There is a noticeable increase in volume accompanying the recent price rise, lending credibility to the bullish move.

The increase in volume supports the price movement upwards, reducing the likelihood of a false breakout.

An unusually high volume spike was observed earlier in the upward move, suggesting potential institutional interest.

Support & Resistance

Around 25,750, where the price is currently approaching.

Around 25,000, which recently acted as a reversal point.

Breaking above the resistance could signal further bullish movement, while failure may lead to a pullback.

Actionable Insights

Consider buying if the price breaks and closes above the 25,750 resistance level with sustained volume.

If the price fails to break the resistance and reverses, consider shorting or taking profits.

Look for confirmation of a break above 25,750 with strong volume for a sustained upward move.

The AI Technical Analysis Center is an informational tool only and does not constitute investment or trading advice.
This site is registered on wpml.org as a development site. Switch to a production site key to remove this banner.