Generic selectors
Exact matches only
Search in title
Search in content
Post Type Selectors

Popular stocks

Crypto

CFD

Currencies

Support

Gold

EUR/USD – Technical Analysis – 4h

January 7, 2026 08:02

Quick Summary

The EUR/USD chart currently displays a predominantly bearish trend, with certain indicators suggesting potential for a reversal if key levels are breached. Despite this, the recent lack of clear movement may indicate a phase of consolidation.

Traders should remain vigilant for any significant changes in market conditions that might affect the currency pair’s direction.

Candlestick Analysis

The recent candlestick patterns on the EUR/USD chart suggest indecision with smaller bodies visible, indicating potential consolidation.

A previously observed bearish engulfing pattern has been followed by a continued downward trend.

No clear breakout patterns are evident, reinforcing the bearish sentiment until a significant reversal pattern forms.

MACD Analysis

The MACD line remains below the signal line, echoing a bearish sentiment with a recent bearish crossover.

The histogram is currently negative but showing signs of convergence towards zero, hinting at weakening bearish momentum.

No significant divergences between the MACD and price action have been identified.

Volume Analysis

Volume analysis indicates steady and moderate activity without major spikes, consistent with the ongoing price action.

The lack of significant volume spikes suggests an absence of abrupt institutional activity.

This steadiness reflects stable selling interest in the market.

Support & Resistance

Key support for the EUR/USD is identified around the 1.1650 level, serving as a holding point during the recent drops.

The nearest resistance level lies between 1.1720 and 1.1750, marking the peaks of recent rallies.

These levels are crucial for determining potential breakout or reversal points in the current trend.

Actionable Insights

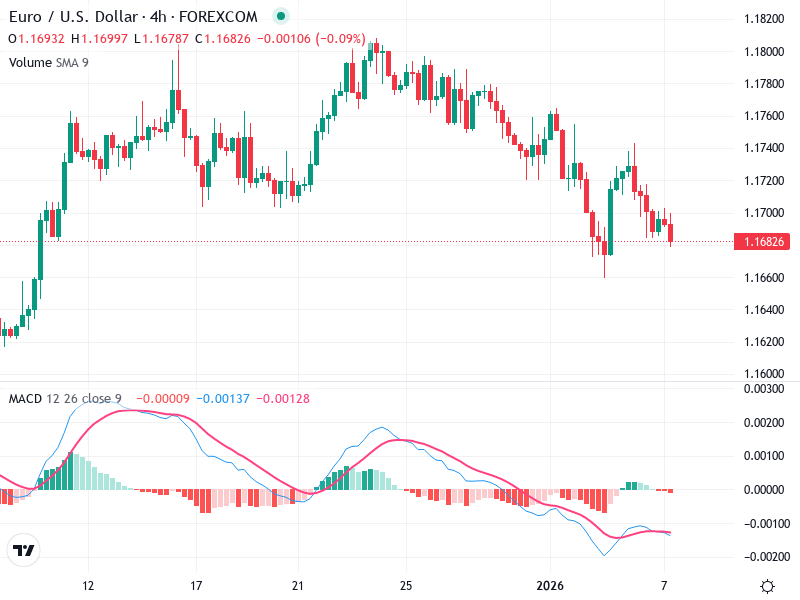
Traders may consider initiating short positions, monitoring for reversal signals near key support levels.

Close observation of the MACD histogram and potential bullish crossover could indicate trend weakening.

A breakdown through the 1.1650 support would confirm bearish continuation, while bullish reversal patterns near current levels could target 1.1720-1.1750 for profit taking.

The AI Technical Analysis Center is an informational tool only and does not constitute investment or trading advice.
This site is registered on wpml.org as a development site. Switch to a production site key to remove this banner.