The chart shows intriguing signs of market movement. The recent patterns indicate potential shifts in sentiment. Watch for possible trend reversals and sustained price actions.
Candlestick Analysis
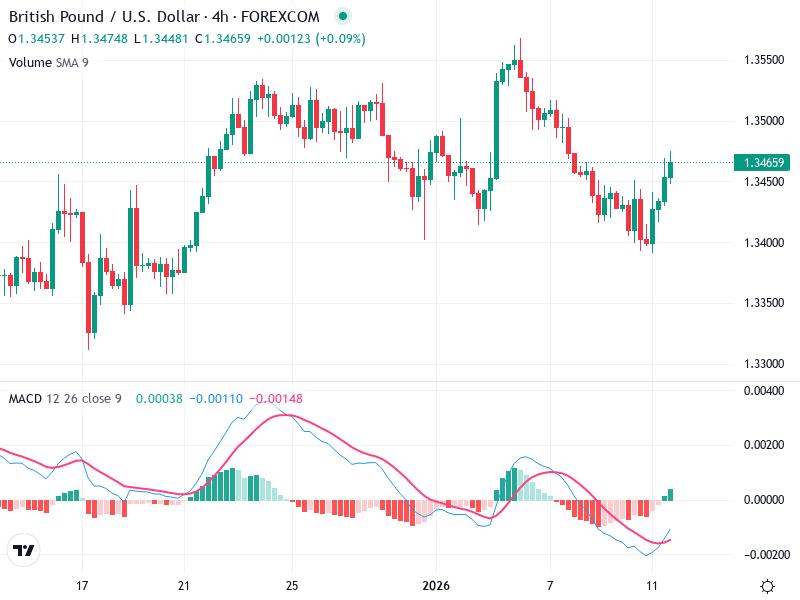
A bullish engulfing pattern is noticeable, indicating potential upward momentum.
The trend is shifting from bearish to bullish with recent higher lows.
There was a breakout above 1.3450, suggesting a new support level.
MACD Analysis
The MACD line has crossed above the Signal line, indicating a bullish crossover.
The MACD histogram shows increasing positive momentum.
There are no clear divergences currently visible.
Volume Analysis
Volume has increased as the price breaks out, strengthening bullish sentiment.
Rising volume during upward movement suggests confirmation of bullish pressure.
The chart shows no significant unusual spikes, indicating steady support.
Support & Resistance
Support is around the 1.3400 level, which has held previously.
Immediate resistance is around the 1.3500 level.
Previous price action encountered selling pressure at resistance.
Actionable Insights
Consider a buy strategy as long as the price remains above 1.3450.
Look for sustained price above breakout with positive MACD for confirmation.
Watch for potential resistance around 1.3500.
The AI Technical Analysis Center is an informational tool only and does not constitute investment or trading advice.