Generic selectors
Exact matches only
Search in title
Search in content
Post Type Selectors

Popular stocks

Crypto

CFD

Currencies

Support

Gold

NSDQ – Technical Analysis – 4h

January 13, 2026 08:00

Quick Summary

The chart reveals a cautiously optimistic outlook. The recent bullish trend is supported by the MACD, though volume is lacking to reinforce the momentum.

Key resistance and support levels are clearly defined, guiding decision-making for potential entry and exit points.

Candlestick Analysis

The overall trend in the recent period is bullish as indicated by rising green candlesticks. However, there is a slight pullback visible at the end of the chart.

No specific strong candlestick patterns like bullish engulfing or hammer are evident. The candles indicate consistent upward movement with minor pullbacks.

The region around 25,800 appears to be a point of resistance from which prices have retreated slightly.

MACD Analysis

The MACD line is above the Signal line, indicating a bullish crossover that supports the recent upward momentum.

The histogram is positive, supporting the bullish crossover, but shows decreasing bars which may suggest weakening momentum.

No clear divergences between MACD and price action can be observed.

Volume Analysis

There was a noticeable spike in volume during the early December reversal, signaling institutional buying possibly at the lower levels.

Current volume levels are below the moving average, which suggests the recent price increase lacks strong volume support.

The prior volume spike suggests strong institutional interest which led to upward movement.

Support & Resistance

The level around 25,800 acts as a resistance zone, where the price is currently struggling.

Support can be seen around 25,200, formed by previous consolidation levels.

These levels are critical for determining future price movement.

Actionable Insights

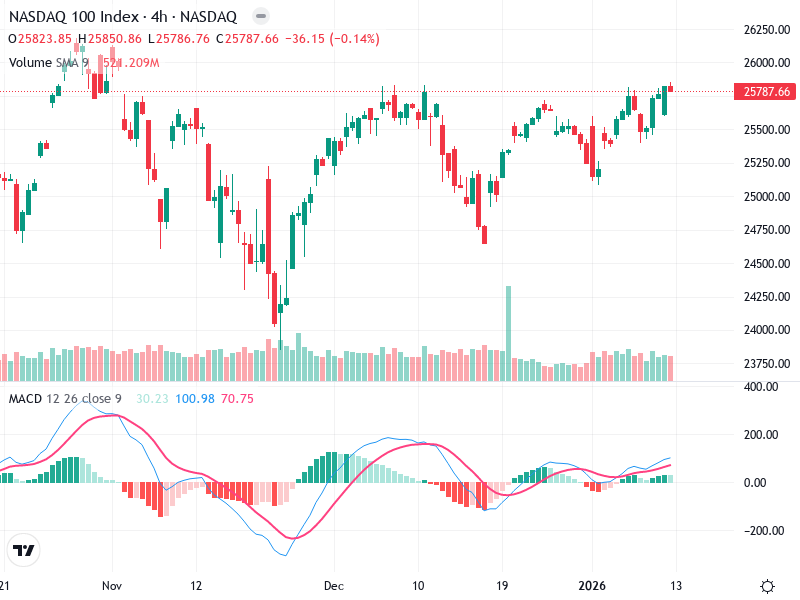
Watch for a breakout above the current resistance level of 25,800 for confirmation of continued bullish momentum. Alternatively, a dip below 25,200 may suggest entering a defensive position.

Look for increased volume to confirm any breakout above resistance or failure below support.

Maintain awareness of key market signals to act promptly.

The AI Technical Analysis Center is an informational tool only and does not constitute investment or trading advice.
This site is registered on wpml.org as a development site. Switch to a production site key to remove this banner.