Generic selectors
Exact matches only
Search in title
Search in content
Post Type Selectors

Popular stocks

Crypto

CFD

Currencies

Support

Gold

AUD/USD – Technical Analysis – 4h

January 13, 2026 13:03

Quick Summary

The chart of the asset shows a mix of significant technical signals. The presence of various candlestick patterns signals potential movements. Additionally, volume and MACD indicators offer insights into the asset’s momentum and market sentiment.

The asset’s behavior around key support and resistance levels further illustrates potential strategic trade zones.

Candlestick Analysis

The chart displays a mix of bullish and bearish patterns, particularly notable around the peak near 0.67500.

The overall trend highlights a bullish movement transitioning into a sideways pattern at the resistance level.

Significant pullback zones are observed near 0.67300 and 0.67000.

MACD Analysis

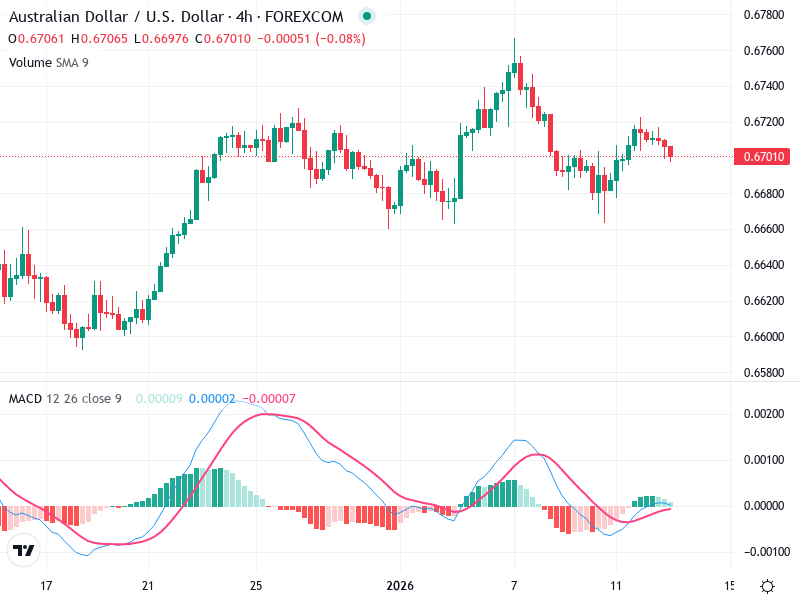
A recent bullish crossover suggests potential upward momentum, albeit a weak one due to the small line difference.

The MACD histogram is slightly positive, with bars near the zero line, indicating mild bullish momentum and suggesting caution.

No strong divergence between MACD and price, indicating alignment with current momentum.

Volume Analysis

Volume remains generally low with minor spikes, indicating a lack of strong institutional activity.

Low volume does not significantly reinforce the minor bullish movements, reflecting cautious market sentiment.

Volume analysis suggests a tentative approach from market participants, lacking strong conviction.

Support & Resistance

Key support levels are near 0.66800 and 0.66200, proposed as potential buying zones on retracement.

Resistance near 0.67500 has been tested but remains unbroken, offering potential selling or shorting opportunities.

The interplay of these levels offers strategic trade setup possibilities.

Actionable Insights

Consider buying on pullbacks near the 0.66800 support level, confirmed by a bullish candlestick pattern.

Consider selling or shorting near 0.67500 resistance when bearish formations occur.

Exercise caution due to low volume and weak momentum signals; it may be prudent to hold until clearer trends emerge.

The AI Technical Analysis Center is an informational tool only and does not constitute investment or trading advice.
This site is registered on wpml.org as a development site. Switch to a production site key to remove this banner.