Generic selectors
Exact matches only
Search in title
Search in content
Post Type Selectors

Popular stocks

Crypto

CFD

Currencies

Support

Gold

NSDQ – Technical Analysis – 4h

January 14, 2026 08:01

Quick Summary

The NASDAQ 100 chart exhibits cautiously bullish tendencies with current momentum suggesting a potential breakout above key resistance levels. The index has shown a recovery from recent lows, showing strength as it approaches significant resistance.

Traders should watch for sustained price action above resistance levels and monitor for increased volume to confirm the bullish sentiment.

Candlestick Analysis

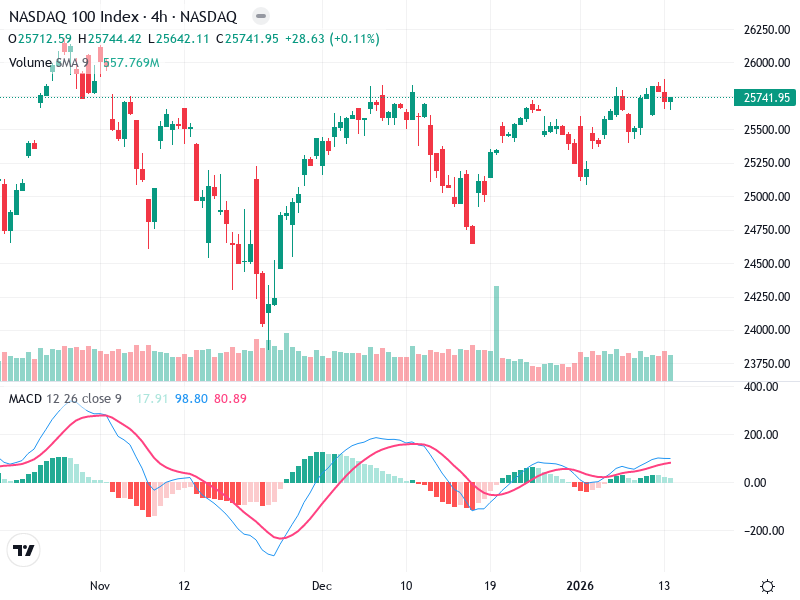
Recently, we observe some small bullish candlesticks indicating potential bullish momentum.

The trend appears to be bullish after a recovery from a lower level, moving upwards from a short-term bottom around mid-December.

The recent resistance level was around 25,750, which the price has approached but not clearly broken yet.

MACD Analysis

Currently, the MACD line is above the Signal line, which is a bullish crossover suggesting positive momentum.

Momentum seems to be slightly gaining as indicated by the increasing histogram bars.

No significant divergences are visible presently between the MACD and the price action.

Volume Analysis

There's a noticeable volume spike in mid-December, likely indicating an institutional activity or capitulation bottom.

Recent uptrends have moderate volume, which supports the strength of the move.

The spike in December might reflect a change in market sentiment or a reaction to external news.

Support & Resistance

25,750 is a key resistance zone. A strong close above this level could reinforce bullish sentiment.

Near 24,500, where previous price consolidation occurred.

A drop below 24,500 could suggest bearish pressure.

Actionable Insights

Consider entering on a confirmed breakout above 25,750 with strong volume.

Watch for reversal signals near resistance or a fail to sustain above resistance.

If currently holding, observe if the price sustains above the key levels mentioned.

The AI Technical Analysis Center is an informational tool only and does not constitute investment or trading advice.
This site is registered on wpml.org as a development site. Switch to a production site key to remove this banner.