Generic selectors
Exact matches only
Search in title
Search in content
Post Type Selectors

Popular stocks

Crypto

CFD

Currencies

Support

Gold

NZD/USD – Technical Analysis – 4h

January 14, 2026 13:00

Quick Summary

The NZD/USD chart displays a generally sideways movement, characterized by fluctuations around the 0.57440 level. The technical indicators provide insights into the current trend and potential future movements for this currency pair.

Traders should be aware of notable resistance and support levels that could influence trading decisions.

Candlestick Analysis

The chart shows a generally sideways movement with short-term fluctuations both upward and downward around the 0.57440 level.

Recent patterns include potential bearish candlesticks following a brief upward trend, indicating a possible pullback or resistance.

The recent high around 0.57800 might act as a resistance, while the support seems to be around 0.57200.

MACD Analysis

The MACD line is slightly above the signal line, indicating a weak bullish sentiment presently.

The MACD histogram shows diminishing bullish momentum, as the bars decrease in height.

There is no clear divergence between MACD and price, suggesting the current sideways trend might continue.

Volume Analysis

Volume appears relatively stable with minor fluctuations.

The lack of volume spikes suggests low institutional activity; recent price movements are not strongly volume-backed.

No significant spikes indicating major buying or selling pressure recently.

Support & Resistance

Support is at approximately 0.57200, marking the lower boundary of recent price action.

Resistance is around 0.57800, a level that price has failed to break recently.

These levels are crucial for traders watching for potential reversals or breakout confirmation.

Actionable Insights

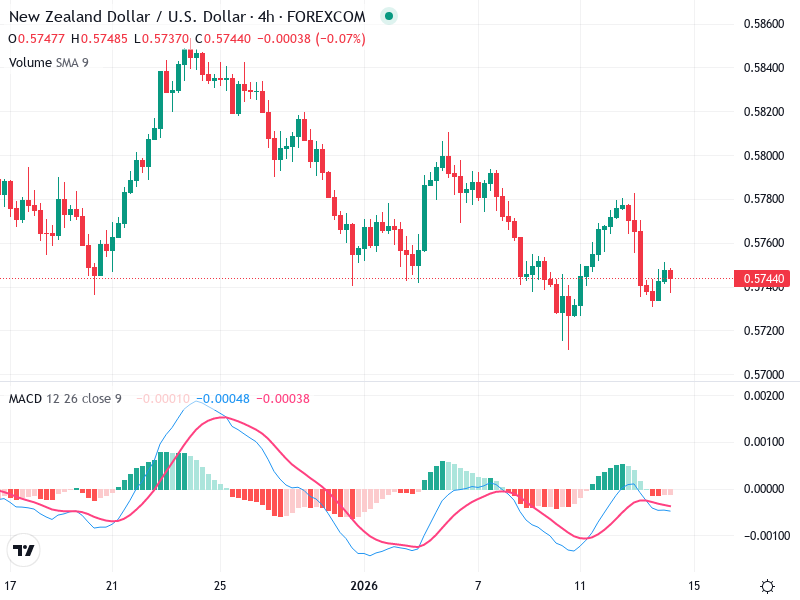
Wait for confirmation of a breakout above 0.57800 with increased volume to consider a bullish position.

Consider selling if price drops below 0.57200, confirmed by volume, signaling weakness.

Given the current sideways trend, holding with cautious observation for clear breakouts might be wise.

The AI Technical Analysis Center is an informational tool only and does not constitute investment or trading advice.
This site is registered on wpml.org as a development site. Switch to a production site key to remove this banner.