Generic selectors
Exact matches only
Search in title
Search in content
Post Type Selectors

Popular stocks

Crypto

CFD

Currencies

Support

Gold

AUD/USD – Technical Analysis – 4h

January 14, 2026 13:02

Quick Summary

The current chart of Forex Pair reveals a subtle transition in market behavior.

Although a previously bullish trend was observed, the Forex Pair now exhibits signs of a potential sideways trend.

Monitoring significant levels might be crucial in anticipating future price movements.

Candlestick Analysis

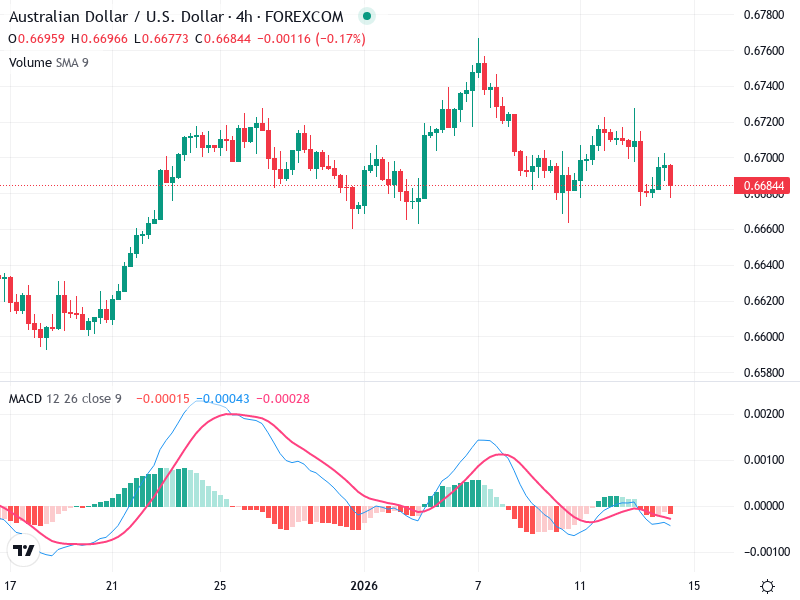
The chart shows no clear major candlestick pattern like a bullish or bearish engulfing, indicating indecision in the market.

Small-bodied candles suggest a potential sideways trend in the near future.

A breakout above 0.67200 could signal the continuation of a bullish trend, while a pullback below 0.66600 could indicate further bearishness.

MACD Analysis

The MACD line is slightly below the Signal line, indicating a recent bearish crossover and decreasing bullish momentum.

The small histogram bars support the idea of declining momentum and a potential sideways market.

No clear divergence is observed currently between the MACD and the price action.

Volume Analysis

Volume has been decreasing, aligning with the sideways price movement and indicating a lack of strong buying or selling conviction.

There are no unusual spikes in volume evident on the chart.

The absence of significant volume spikes suggests limited institutional activity at this time.

Support & Resistance

Around 0.66600 is acting as a key support level.

The 0.67200 level is a resistance zone and a potential breakout point for bulls.

Monitoring these levels may offer insights into future price direction.

Actionable Insights

Consider a 'hold' strategy due to the sideways movement.

Await a breakout above 0.67200 for buying signals or a fall below 0.66600 for potential selling opportunities.

Look for confirmation signals on higher volume for breakouts or additional candlestick patterns like engulfing or hammer.

The AI Technical Analysis Center is an informational tool only and does not constitute investment or trading advice.
This site is registered on wpml.org as a development site. Switch to a production site key to remove this banner.