Generic selectors
Exact matches only
Search in title
Search in content
Post Type Selectors

Popular stocks

Crypto

CFD

Currencies

Support

Gold

NZD/USD – Technical Analysis – 4h

January 15, 2026 13:01

Quick Summary

The NZD/USD chart shows a period of consolidation with a sideways trend. The asset is displaying signs of indecision with no clear direction as indicated by candlestick patterns and low trading volume. The key levels of support and resistance are critical in anticipating future movements.

Candlestick Analysis

The chart shows a sequence of bearish and bullish movements without distinct reversal patterns like dojis or hammers, indicating indecision in the market.

The broader trend appears sideways with a slight bearish bias, as shown by lower highs.

There is a notable resistance around the 0.5760 level where prices have repeatedly failed to breach. The range between 0.57400.5760 seems to be a recent consolidation zone.

MACD Analysis

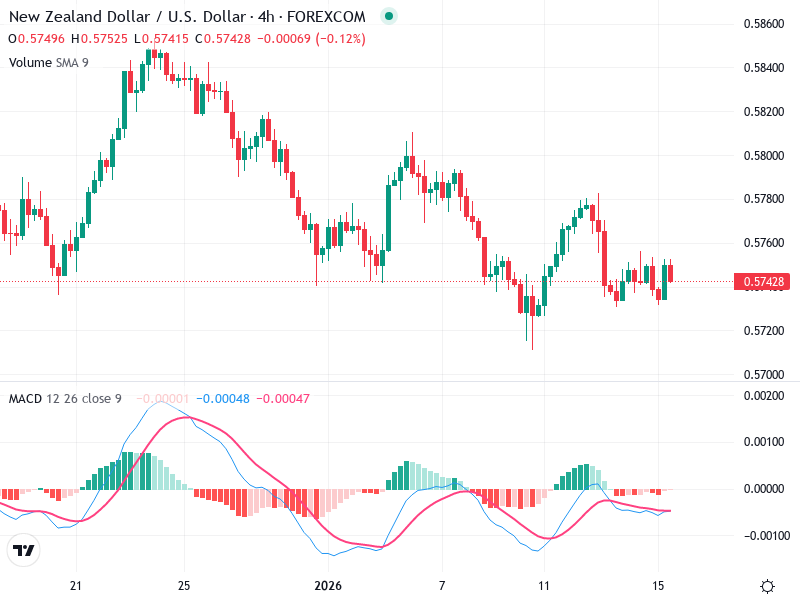
Currently, the MACD line is slightly below the Signal line after a recent bearish crossover, indicating possible short-term weakness.

The histogram is slightly negative, suggesting weakening momentum to the downside.

There are no clear divergences between the MACD and price action, signaling current trends are in line with momentum.

Volume Analysis

Volume has decreased, indicating reduced market participation during the consolidation phase.

The low volume supports the sideways movement, hinting at the lack of strong commitment from either bulls or bears.

No recent significant volume spikes to suggest institutional activity or strong breakouts.

Support & Resistance

Key Support Level: Around 0.5720, where previous pullbacks have found buying interest.

Key Resistance Level: Around 0.5760, which has held as a barrier to upward movements.

The range between these levels serves as a consolidation zone, reflecting the market's indecision.

Actionable Insights

Consider entering long positions on a confirmed breakout above resistance at 0.5760 with volume confirmation.

Conversely, short opportunities may arise if the price decisively breaks below the support at 0.5720 with increased bearish momentum.

For now, holding may be prudent as the price consolidates. Look for a confirmed breakout from this range accompanied by a notable change in volume as a potential signal for direction.

The AI Technical Analysis Center is an informational tool only and does not constitute investment or trading advice.
This site is registered on wpml.org as a development site. Switch to a production site key to remove this banner.