Generic selectors
Exact matches only
Search in title
Search in content
Post Type Selectors

Popular stocks

Crypto

CFD

Currencies

Support

Gold

GBP/USD – Technical Analysis – 4h

January 16, 2026 13:05

Quick Summary

The GBP/USD chart showcases a recent downward trend with signs of a slight recovery. Key patterns and levels are forming, indicating potential market movements.

The asset shows a series of technical signals pointing toward a possible change in direction.

Candlestick Analysis

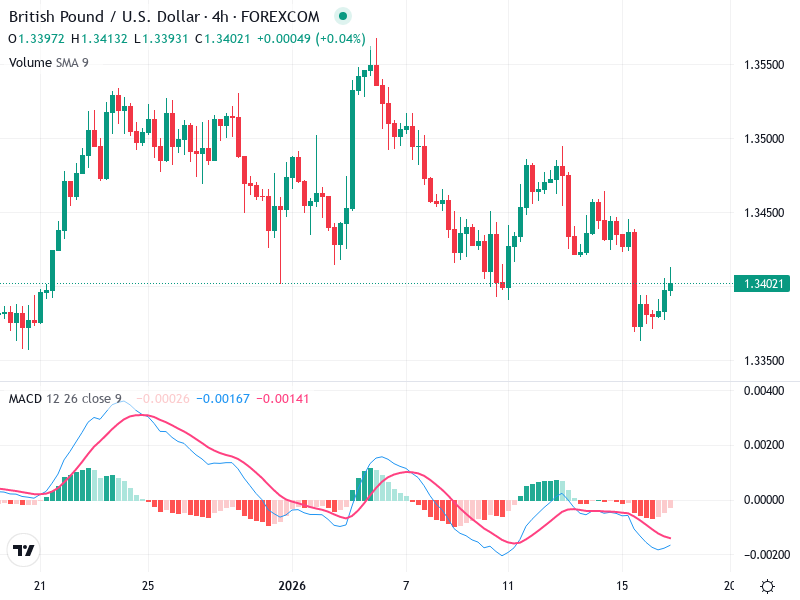
The chart shows a recent downward trend with several pullbacks. However, there's a slight recovery visible at the end.

There’s a potential formation of a hammer candlestick in the recent bars, indicating a possible reversal or support.

The recent price action suggests a breakout from the downward move, with potential resistance around the 1.34500 level.

MACD Analysis

The MACD line is close to crossing above the signal line, which may indicate an emerging bullish crossover.

The MACD histogram is gradually shifting from negative to positive, suggesting a slowdown in bearish momentum.

There is no clear divergence at this point, but the MACD suggests a potential shift in momentum.

Volume Analysis

Trading volume appears to have increased slightly during the recent recovery, which can indicate support for the price rise.

Volume spikes coincide with price changes, strengthening the validity of the current price movement.

No significant unusual spikes were observed to suggest strong institutional buying or selling.

Support & Resistance

The 1.33500 level appears to be a significant support zone where recent buyers stepped in.

The area around 1.34500 is crucial, acting as immediate resistance, which if broken, could lead to further upside.

These levels are essential for assessing potential entry and exit points.

Actionable Insights

Consider buying if the price holds above 1.33500 and the MACD confirms with a crossover.

If the resistance at 1.34500 holds strongly, a short position could be considered with a stop above this level.

Holding positions for now might be wise until confirmation of a breakout or breakdown is evident.

The AI Technical Analysis Center is an informational tool only and does not constitute investment or trading advice.
This site is registered on wpml.org as a development site. Switch to a production site key to remove this banner.