Generic selectors
Exact matches only
Search in title
Search in content
Post Type Selectors

Popular stocks

Crypto

CFD

Currencies

Support

Gold

AUD/USD – Technical Analysis – 4h

January 19, 2026 13:03

Quick Summary

The chart analysis of the asset reveals a sideways trend with mixed bullish and bearish candlesticks. The asset shows consolidation at key levels, with resistance around 0.67200 and support at 0.66800. Traders should watch for potential breakouts at these levels for directional cues.

Candlestick Analysis

The chart shows a mix of bullish and bearish candlesticks with a lack of dominant significant patterns like the bullish engulfing or doji at key turning points.

Recent candles suggest a sideways trend with some smaller bullish candles suggesting slight upward momentum.

There is no clear breakout zone visible in recent candles, indicating consolidation.

MACD Analysis

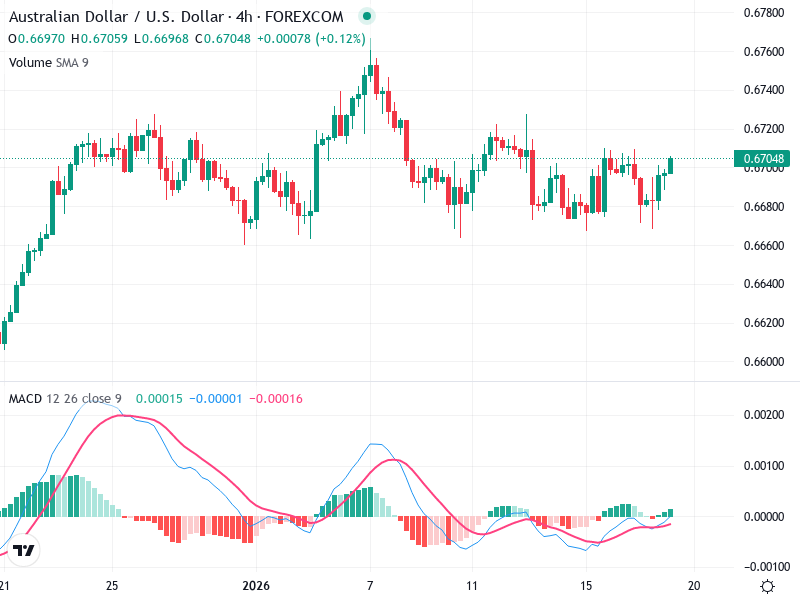
The MACD line is slightly above the Signal line, suggesting a possible bullish crossover.

The histogram is showing small positive bars, indicating weak bullish momentum.

Currently, there are no significant divergences between the MACD and price action. Both are aligned towards a sideways to slightly bullish perspective.

Volume Analysis

Volume is relatively consistent with no major spikes, suggesting low institutional activity.

Lack of strong volume support for price movements can indicate weak bullish conviction.

No unusual volume spikes observed.

Support & Resistance

Key support around 0.66800 ensures stability in price movements downward.

Noted significant resistance at approximately 0.67200, which has been tested but not broken.

Breaching these levels with volume could indicate stronger directional movement.

Actionable Insights

Consider a cautious 'hold' strategy given the consolidation, watching for a breakout above 0.67200 or a drop below 0.66800.

Watch for a confirmed breakout with increased volume for potential buy/sell indicators.

False breakouts due to low volume during consolidation could warrant cautious positioning.

The AI Technical Analysis Center is an informational tool only and does not constitute investment or trading advice.
This site is registered on wpml.org as a development site. Switch to a production site key to remove this banner.