Generic selectors
Exact matches only
Search in title
Search in content
Post Type Selectors

Popular stocks

Crypto

CFD

Currencies

Support

Gold

NSDQ – Technical Analysis – 4h

January 20, 2026 08:01

Quick Summary

The current analysis for Asset presents a cautious approach towards its pricing behavior. The chart shows a mixture of trends and signals that suggest a nuanced observation is needed.

The asset is displaying sideways trends with moments of volatility, indicating no dominant bullish or bearish momentum in the longer-term timeframe.

Candlestick Analysis

The overall trend seems to be sideways with periods of volatility, showcasing no strong, sustained bullish or bearish trend in the timeframe.

Instances of both bullish and bearish engulfing patterns indicate short-term reversals within a broader sideways trend.

Doji candlesticks at current price levels suggest potential reversals or continuation, depending on ensuing patterns.

MACD Analysis

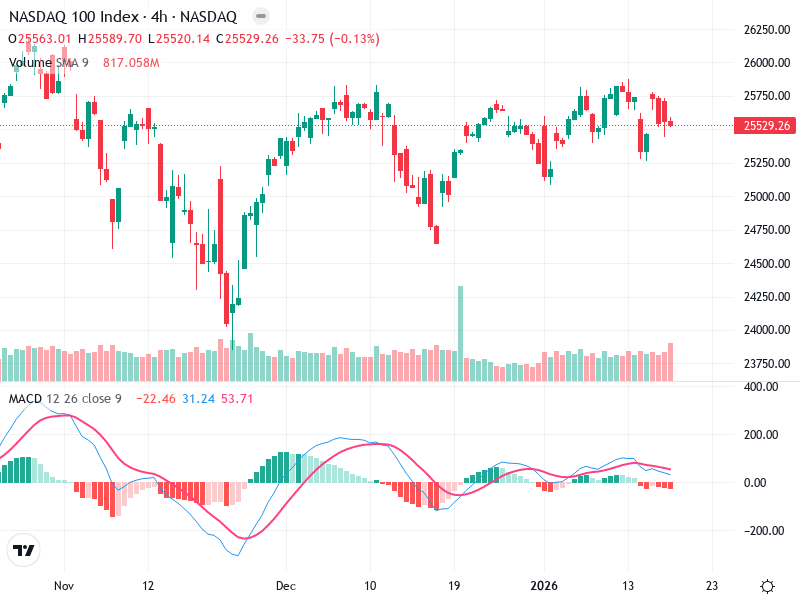
The MACD line is crossing below the Signal line, indicating a bearish crossover, suggesting potential downside momentum.

The MACD histogram shows increasing negative values, supporting the bearish crossover and hinting at strengthening bearish momentum.

No significant divergence between MACD and price action is evident, confirming momentum alignment with recent price movements.

Volume Analysis

Sporadic volume spikes, especially during large price movements, indicate potential institutional activity.

Recent price declines are accompanied by higher volume, supporting downward movement and suggesting sustained selling pressure.

Notably high volumes coincide with larger candlesticks, hinting at significant trade interest and possible institutional involvement.

Support & Resistance

Key support is around 24,500, suggesting previous rebound levels.

Resistance is observed at 25,750, where the price has struggled to break.

These levels are crucial for predicting future price action; a breakout above resistance or below support could set medium-term trends.

Actionable Insights

Consider buying if the price breaks above the 25,750 resistance with strong volume, indicating a potential uptrend.

A break below the 24,500 support with confirming volume and MACD momentum could signal selling or shorting.

Holding might be appropriate if the price remains range-bound between these levels without significant momentum shifts.

The AI Technical Analysis Center is an informational tool only and does not constitute investment or trading advice.
This site is registered on wpml.org as a development site. Switch to a production site key to remove this banner.