Generic selectors
Exact matches only
Search in title
Search in content
Post Type Selectors

Popular stocks

Crypto

CFD

Currencies

Support

Gold

NZD/USD – Technical Analysis – 4h

January 20, 2026 13:00

Quick Summary

The chart demonstrates a robust bullish trend, characterized by rising candlestick patterns and increased momentum. The asset shows strong market interest, reflected in the substantial volume supporting the current price movement.

Candlestick Analysis

The chart displays a strong bullish trend with a series of green candlesticks indicating upward momentum.

There is no clear formation of a bearish reversal pattern at the chart's end, like a doji or hammer.

The overall trend in this segment is bullish, as indicated by the series of higher highs and higher lows.

MACD Analysis

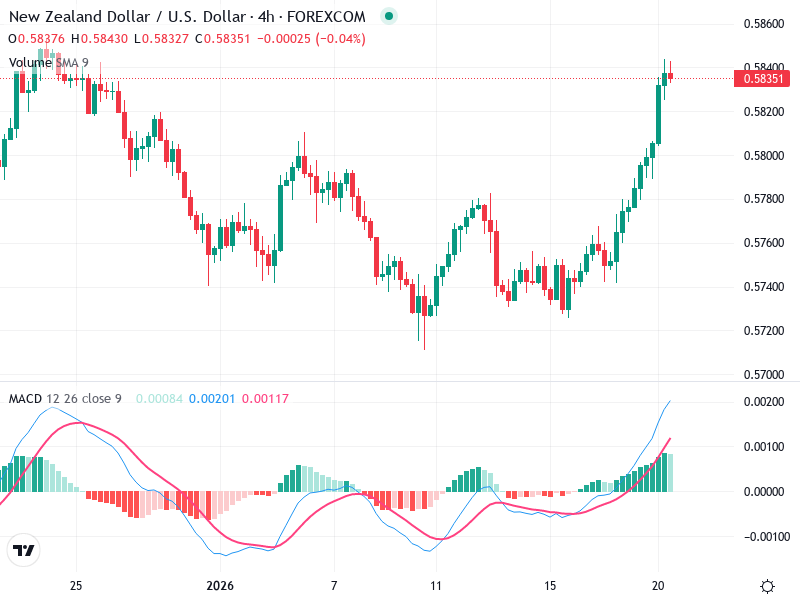
The MACD line has crossed above the Signal line, indicating a bullish crossover, which is a positive sign for continued upward momentum.

The histogram is increasing in the positive area, which suggests strong bullish momentum.

There is no visible divergence between the MACD and price action, supporting the current upward trend.

Volume Analysis

There is a significant increase in volume supporting the recent upward price movement, suggesting robust buying interest.

The increase in volume during price rises confirms the strength of the bullish trend.

No unusual volume spikes that contradict the trend are observed.

Support & Resistance

Key support is seen at the 0.5800 level, the area of the recent breakout.

The next significant resistance could be at the 0.5860 area, a level previously tested before the current chart segment.

Look for a sustained move above the resistance level for further confirmation of trend continuation.

Actionable Insights

Consider entering a long position, given the bullish trend and confirmation from increased volume and MACD crossover.

Look for a sustained move above the 0.5860 resistance level for further confirmation of the continuation of the uptrend.

Watch for any bearish reversal patterns that might indicate a retracement, as well as potential resistance at the 0.5860 level.

The AI Technical Analysis Center is an informational tool only and does not constitute investment or trading advice.
This site is registered on wpml.org as a development site. Switch to a production site key to remove this banner.